Figure 8.
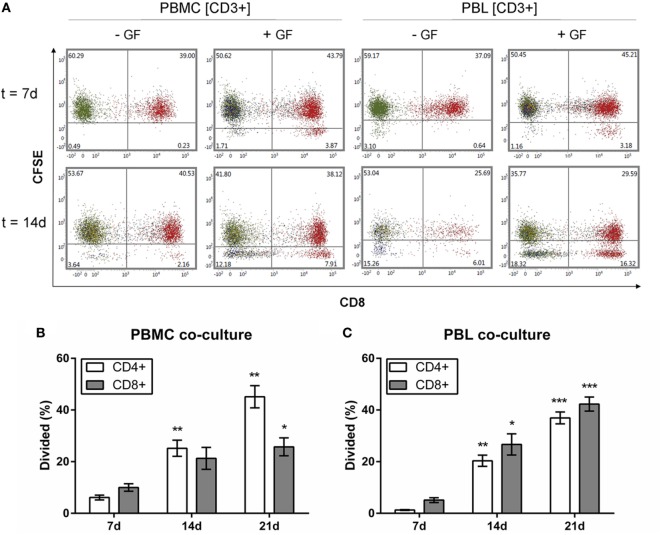
CD3+CD4+ and CD3+CD8+ cells proliferate in the presence of gingival fibroblasts (GFs). Quantification of proliferating Carboxyfluorescein succinimidyl ester (CFSE)-labeled CD3+ cells over time. (A) Dot plots of CD3+ cells within peripheral blood mononuclear cell (PBMC) (left panels) and peripheral blood lymphocyte (PBL) (right panels) cocultures after 7 (upper panels) and 14 days (lower panels). CFSE intensity is plotted on the y-axis and CD8+ is plotted on the x-axis. CD3+CD8+ cells are shown in red, CD3+CD8− (CD3+CD4+) cells are shown in green. Numbers in lower quadrants indicate the percentages of cells that have divided. (B) Quantification of the divided CD4+ (white bars) and CD8+ (gray bars) cells (normalized percentages ± SEM) in PBMC cocultures over time. (C) Quantification of the divided CD4+ (white bars) and CD8+ (gray bars) cells (normalized percentages ± SEM) in PBL cocultures over time. All significant differences were compared to 7 days. n = 5 GF donors, *p < 0.05, **<0.01, ***<0.001.

