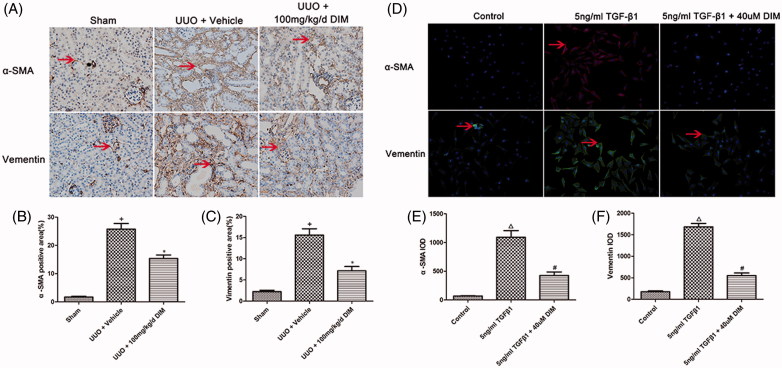
Figure 3.
Analysis of fibroblast-to-myofibroblast transition in vivo and in vitro. (A) Immunohistochemistry staining of α-SMA and vimentin (magnification, 200×) in the sham and the UUO models; (B) and (C) Semi-quantitative immunohistochemistry staining of α-SMA and vimentin in the sham group and the UUO model; (D) Immunofluorescence of α-SMA and vimentin in TGF-β1-activated fibroblast cell model. (E) and (F) IOD value of α-SMA and vimentin in the cell model. +p < .05 vs. the sham group, *p < .05 vs. UUO + the vehicle group, Δp < .05 vs. the control group, #p < .05 vs. the 5ng/ml TGF-β1 group; Arrow, positive signal.

