
FIGURE 6.
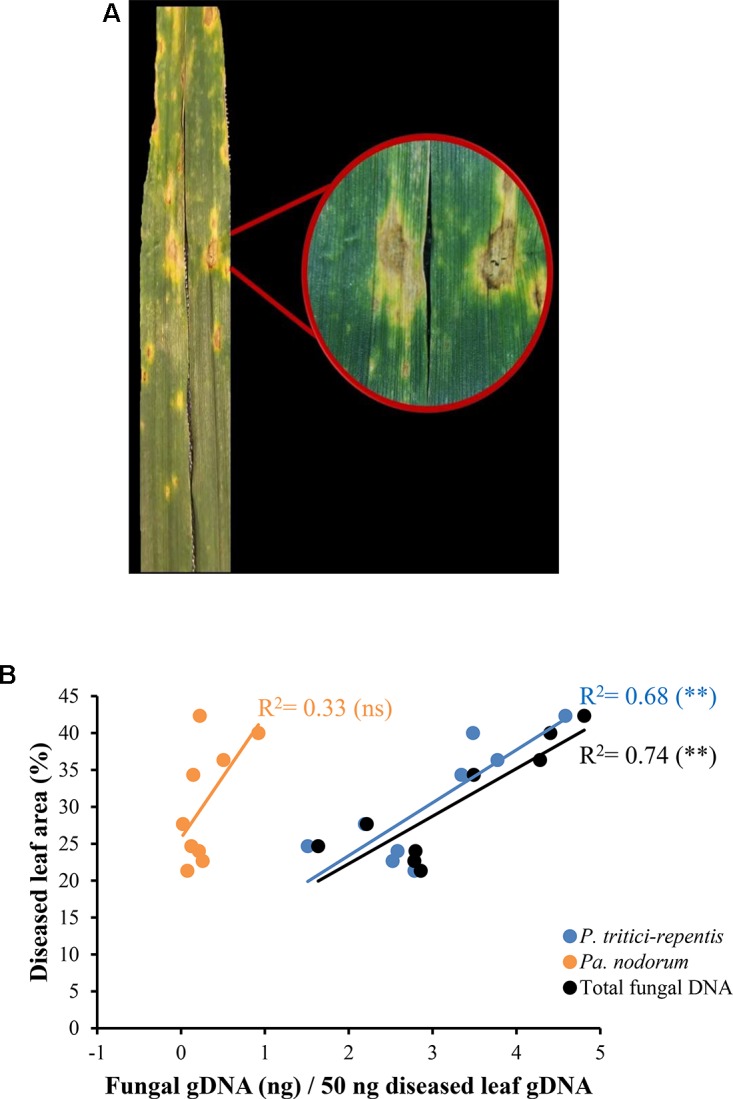
Quantification of fungal DNA in naturally infected wheat leaves. (A) Leaves displaying tan spot symptoms with tan necrotic centers and yellow halos. (B) A linear model fitted into the relationship between fungal DNA measured in real-time quantitative PCR and conventional disease score. The corresponding regression equation and coefficient of determination (R2) are shown on the plot. ns and ∗∗ refer to not significant and significant (P < 0.01), respectively.