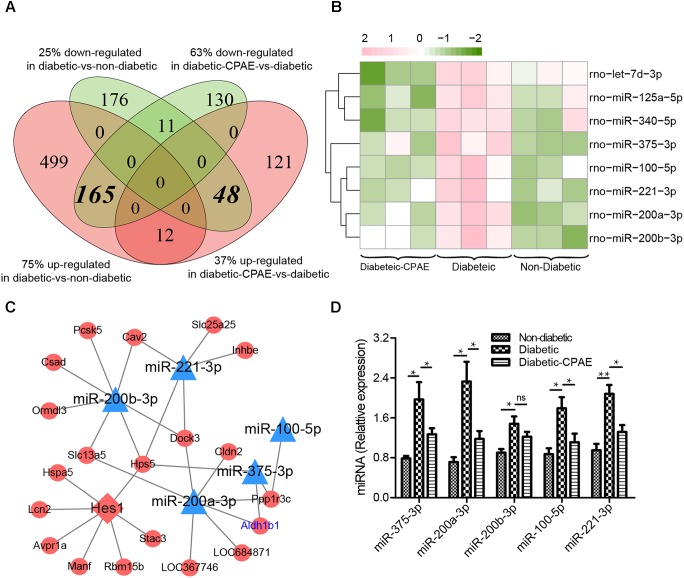
FIGURE 5.
The expression levels and regulatory network of DEGs in liver tissues of three groups rat models. (A) The counts of DEGs in two comparisons for liver tissues (diabetic-VS-non-diabetic, diabetic-CPAE-VS-diabetic) (n = 3). (B) The expression levels of DEMs for both comparisons in liver tissues (n = 3). Red: up-regulation; green: down-regulation. (C) The miRNA-TF-Target regulatory network for liver tissues (n = 3). Triangle: miRNA; diamond: transcription factor; ellipse: gene; blue: up-regulation in diabetic-VS-non-diabetic and down-regulation in diabetic-CPAE-VS-diabetic; red: down-regulation in diabetic-VS-non-diabetic and up-regulation in diabetic-CPAE-VS-diabetic. (D) Real-time qPCR analysis for miRNA expression (n = 6). ∗p < 0.05, ∗∗p < 0.001.

