
Fig. 1.
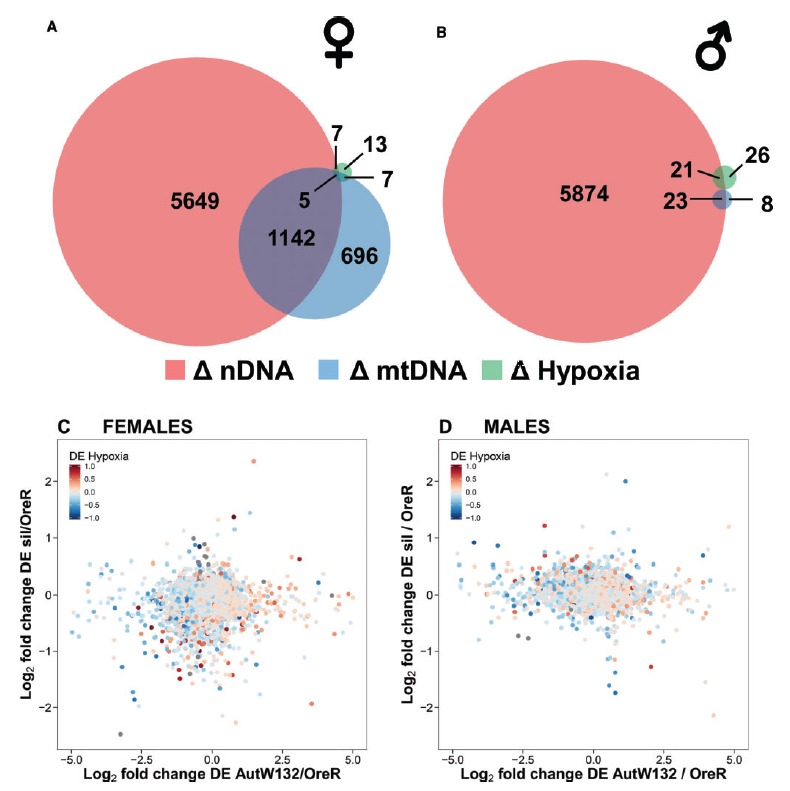
First order genetic and hypoxia effects in females and males. Scaled Venn diagrams describe the number of differentially expressed genes by nDNA (red), mtDNA (blue) and hypoxia (green) in females (A) and males (B) at FDR < 0.1. There was some overlap between the DE gene sets and some genes were sensitive to all three genetic and hypoxia perturbations. Females were generally more sensitive to nDNA and mtDNA variation. Biplots with a heat component (females: C and males: D) show the log2-fold change in expression for nDNA (AutW132/OreR) (abscissa), mtDNA (siI/OreR) (ordinal) and hypoxia [combined 30 min and 120 min of hypoxia/0 min (control)] (heat). The heat component is the hypoxia effect and the scale is from −1 to 1. Data in grey are outside of the −1 to 1 log2-fold range but still contribute to the mtDNA–nDNA correlation reported in the main text.