
Fig. 2.
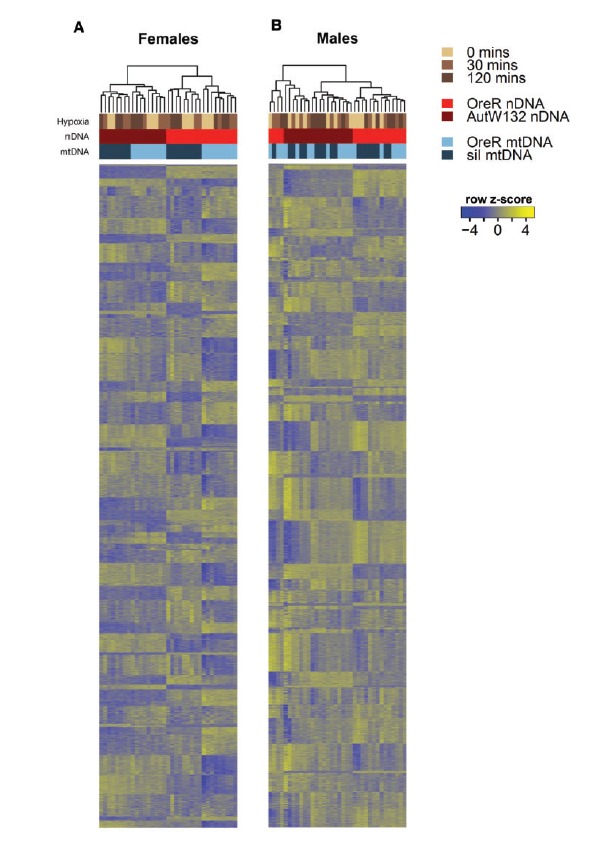
Gene and library clusters of the top 70% of genes by read count. Heat maps show the clustering of libraries in females (A) and males (B) using k = 70 clusters; calculated using MBCluster.Seq. The three forms of experimental variation are shown as colored bars at the top of each heat map. Browns show hypoxia treatment, reds are alternative nuclear backgrounds and blues are alternative mtDNA haplotypes. Column (library) dendrograms describe the clustering of libraries using the hierarchical clustering approach in the heatmap3 function (Zhao et al. 2014). Each row in the heatmap is a gene and these are ordered based on their cluster membership (1–70). The rows do not correspond with the same gene across sexes. The relative expression (row z-score) of each gene is scaled on a per gene basis. Relatively high expression is shown in yellow; relatively low expression is shown as blue. In females, mitonuclear genotypes are clearly differentiated by expression, whereas males show less defined genetic signal in the expression data.