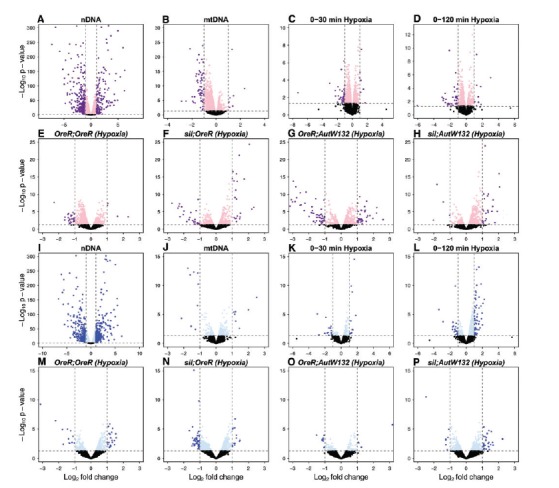
Fig. 3.

First order DE and genotype signatures of hypoxia. Volcano plots show female (A–H) and male (I–P) differential expression responses to nDNA (A, I), mtDNA (B, J), initial hypoxia (C, K), and longer hypoxic exposure (0–120 min) (D, L). Individual (mtDNA;nDNA) genotype responses to combined hypoxic treatments are shown for OreR;OreR (E, M), siI;OreR (F, N), OreR;AutW132 (G, O) and siI;AutW132 (H, P). Log2-fold changes are on the abscissa and −log10P-values are shown in the ordinal. Horizontal dashed grey lines highlight P-value =0.05. Vertical dashed grey lines highlight ± 1 on a log2 fold scale (2 fold up- or down-regulated). Dark purple and dark blue data highlight genes with ± 1 log2 fold change and P < 0.05, in females and males, respectively.
