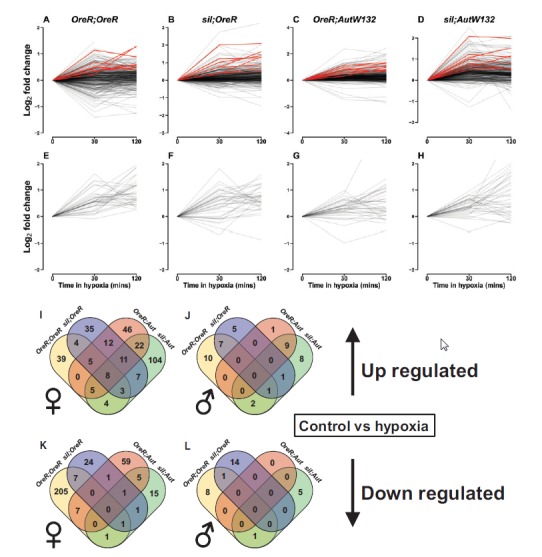
Fig. 4.

Genotypes show both conserved (intersected) and private gene expression responses to combined hypoxia treatments. (A–H) show the norms of reaction for each genotype for all upregulated genes across all genotypes, measured as the log2 fold change relative to t = 0 min in hypoxia. Females (A–D) and male (E–H) norms of reaction are shown. Red lines in A–D show the eight consistently upregulated genes across all four genotypes in females (FDR < 0.1). Black lines show the remaining genes that are differentially upregulated in at least one genotype. Genes that are upregulated in at least one genotype are often downregulated in another. Venn intersections in (I–L) show the numbers of genes that are intersected and private to individual genotypes. Female up- (I) and down-regulated (K) genes are those genes DE by combined hypoxic treatments relative to the control (0 min in hypoxia). Equivalent male plots are shown in (J) and (L). A large majority of genes were private to individual genotypes in both up- and down-regulated genes (larger numbers on margins of Venn diagrams).
