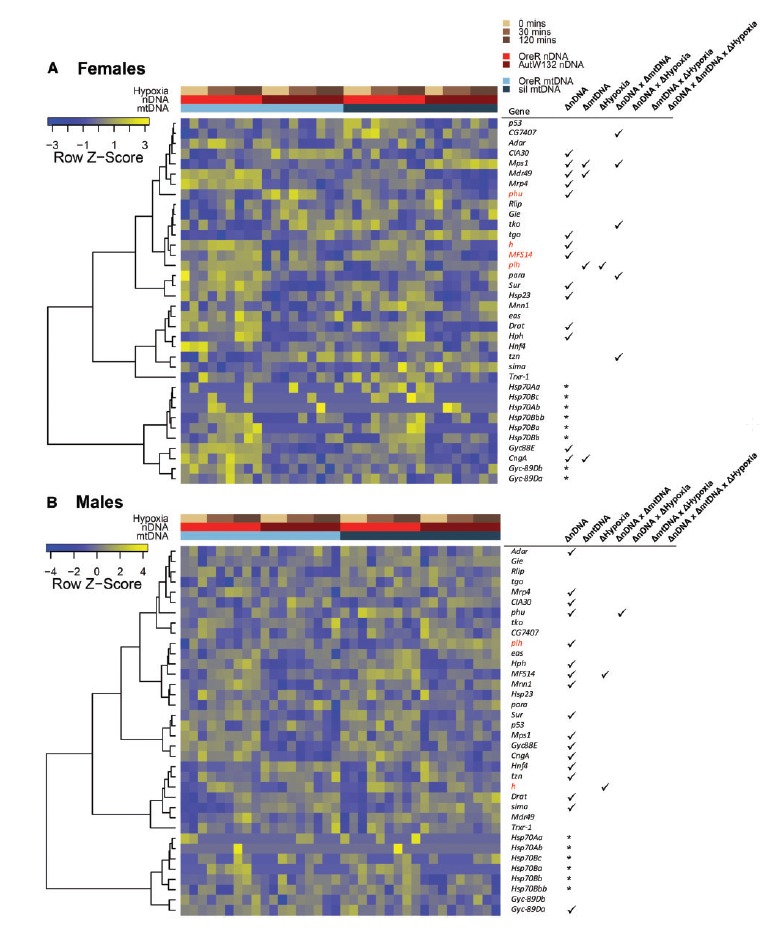
Fig. 5.

Known hypoxia genes show first order genetic and environment effects, along with significant interaction effects on expression. Heatmaps show relative gene expression patterns of known hypoxia-response genes in females (A) and males (B). Heatmaps are clustered by gene expression patterns using the hierarchical clustering as implemented in the heatmap3 function (Zhao et al. 2014). Dendrograms of genes describe the gene clusters. Libraries (columns) are sorted by mitonuclear genotype and time in hypoxia. Colored bars above the heatmaps describe the experimental treatment of individual RNA-seq libraries. Tables to the right of heatmaps show the gene ID and ticks highlight if that gene was significantly DE (FDR < 0.1) by a genetic or environmental effect, and any significant interaction effect. Genes in red were significantly differentially expressed (up- or down-regulated) by hypoxia in at least one genotype. The hypoxia term in the table describes whether there was an overall significant hypoxia effect with all genotypes combined in the analysis. An asterisk means that gene was not included in the combined genotype model due to insufficient read counts.
