
Fig. 7.
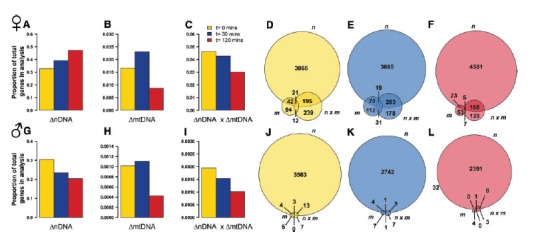
Genetic effects and interactions are modified by hypoxia. Barplots in (A, B, C) show the proportion of genes in females that were differentially expressed by nDNA, mtDNA, and nDNA x mtDNA, respectively, at different hypoxia treatments: 0 min (yellow), 30 min (blue), and 120 min (red) (FDR < 0.1). Equivalent barplots for males are shown in (G, H, and I). Under 30 min of hypoxia, the signature of mtDNA variation increased in proportion in both sexes. The proportion of nDNA × mtDNA decreased with increasing time in hypoxia in both sexes. In females, the number of DE nDNA genes increased with time in hypoxia, whereas the proportion in males decreased. Venn diagrams in (D, E, and F) show the intersections between first order nDNA, mtDNA, and higher order nDNA × mtDNA interactions for females at hypoxia treatments: 0 min (yellow), 30 min (blue), and 120 min (red). The equivalent Venn diagrams for males are shown in (J, K, and L).