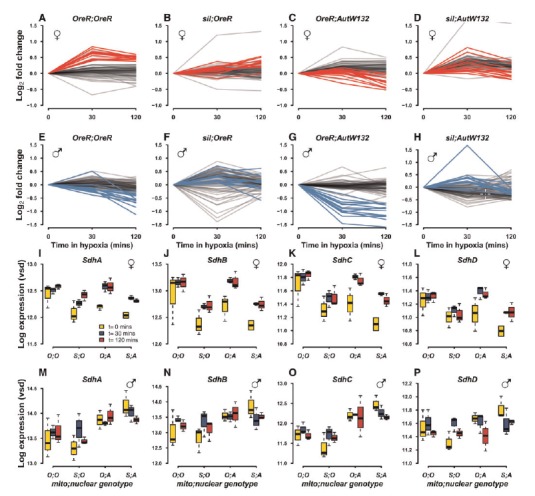
Fig. 8.

Oxidative phosphorylation genes encoded by mtDNA and nDNA are among the most differentially expressed by hypoxia. Norms of reaction for log2 fold change relative to hypoxia timepoint = 0 are shown for individual genotypes in females (A–D) and males (E–H). Red lines in (A–D) and blue lines in (E–H) show the mtDNA-encoded genes in females and males, respectively. Black lines show the remaining nDNA-encoded genes that comprise the Complexes I–IV and ATP synthetase. Boxplots in (I–L: females) and (M–P: males) show the expression of succinate dehydrogenase genes (SdhA, SdhB, SdhC, and SdhD) of complex II of the electron transport chain.
