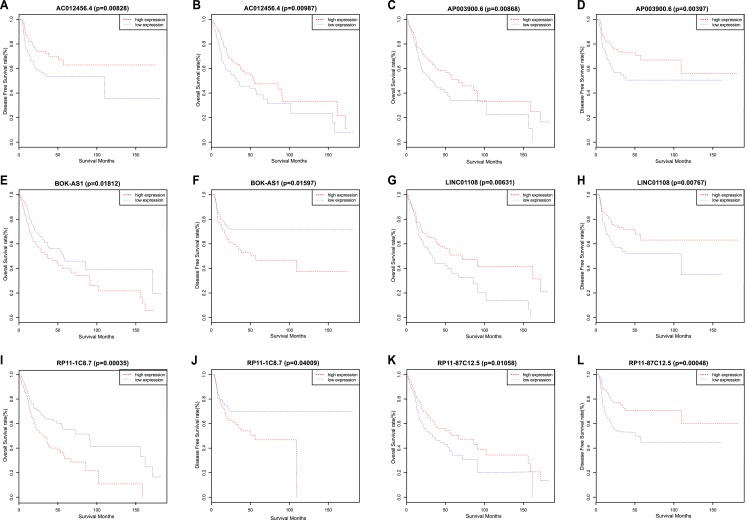
Figure 2. Kaplan–Meier survival analyses and log-rank tests for OS and DFS in OSCC.
(A) OS and (B) DFS rates of all patients according to AC012456.4 expression. (C) OS and (D) DFS rates of all patients according to AP003900.6 expression. (E) OS and (F) DFS rates of all patients according to BOK-AS1 expression. (G) OS and (H) DFS rates of all patients according to LINC01108 expression. (I) OS and (J) DFS rates of all patients according to RP11-1C8.7 expression. (K) OS and (L) DFS rates of all patients according to RP11-87C12.5 expression.

