
Figure 2. Position Depiction Within Candidate Events During Sleep 1 and Run 1.
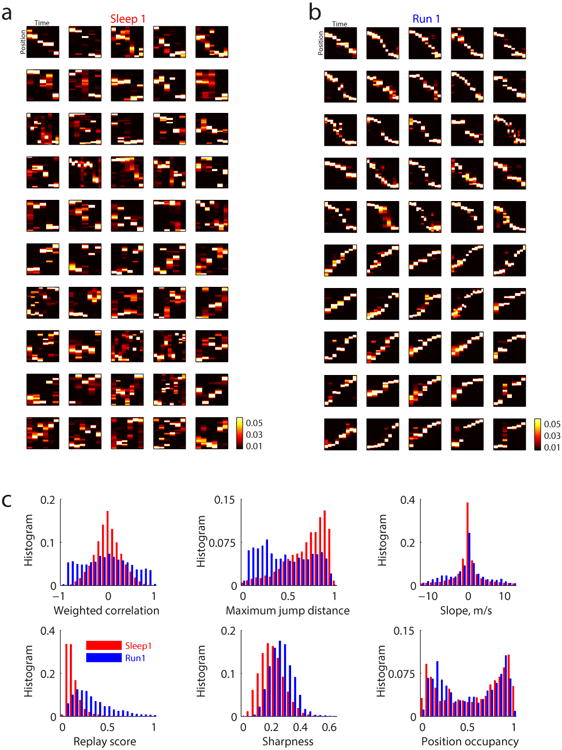
(a) Top 25 positively and top 25 negatively correlated events of Track 1 in Sleep1 using the same 114 cells from Figure 1. Each subplot is the decoding of a candidate event with the y axis representing position and spanning the full length of the track (1.8 meters), and the x axis representing time for which each pixel is 20 ms wide. The scale of decoded posterior probabilities is shown in the colorbar. (b) Top 25 positively and top 25 negatively correlated events of Track 1 in Run 1 using the same 114 cells from Figure1. Scales are the same as in a). (c) Quantifications of 9818 candidate events during Sleep 1 and 4438 candidate events during Run 1. Median ± s.e.m, Sleep 1 versus Run 1: 0.17 ± 0.00 versus 0.40 ± 0.00 for absolute weighted correlation, 0.75 ± 0.00 versus 0.43 ± 0.00 for maximum jump distance, 1.25 ± 0.07 versus 2.5 ± 0.06 for slope, 1.00 ± 0.00 versus 0.27± 0.00 for replay score, 0.19± 0.00 versus 0.26± 0.00 for sharpness, 0.61± 0.00 versus 0.51± 0.00 for position occupancy, all with p<10-10 from Wilcoxon rank sum test.