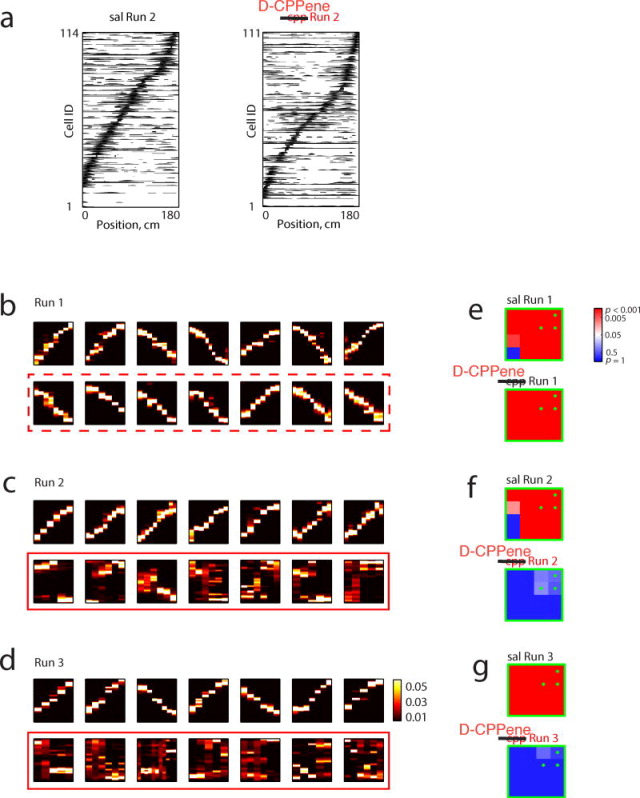
Figure 4. NMDAR Antagonism Spares Place Fields But Abolishes Replay.
(a) Place field rate maps of 114 place cells and 111 place cells from two sessions arranged by their peak firing positions on Track2 during Run2 after administration of saline and D-CPPene respectively. (b, c, and d) Top 7 correlated events expressed during Run 1, Run 2 and Run 3 on a saline day (top) and a D-CPPene day (bottom; red box, red dashed box denotes D-CPPene day before drug administration). (e, f, and g) Significance matrix of trajectory events for each run and each condition.

