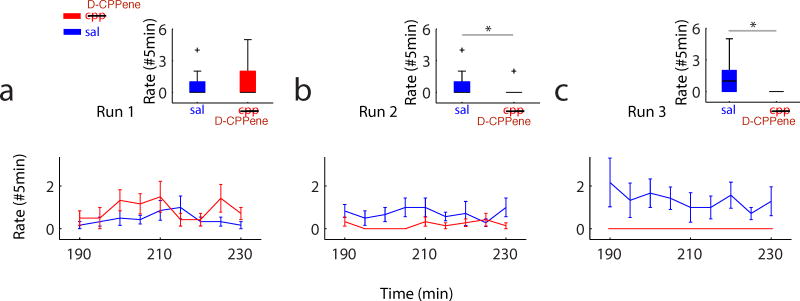
Figure 8. Retrieved Trajectory Events Over Time.
Rate of Run 1, Run 2, and Run 3 retrieved trajectory events in a 45 min period during Sleep 3 across all animals under saline (blue) and D-CPPene conditions. Corresponding bars illustrate the average number of retrieved trajectory events in a 5min period for each run and each condition (errorbar denotes s.e.m.) under detection thresholds of absolute correlation greater than 0.6 and maximum jump distance less than 0.4. Boxplot at the top, rate of retrieved trajectory events between Saline and D-CPPene, Wilcoxon rank sum test: p=0.07 for Run 1, p=1.73*10-4 for Run 2, p=1.22*10-11 for Run 3. Box edges are the 25th (q1) and 75th (q3) percentiles of the data. Black line in the box shows the median. Red crosses mark the biggest or smallest outlier. Outliers are defined as values larger than q3 + 1.5*(q3 – q1) or smaller than q1 – 1.5*(q3 – q1). The black whiskers extend to the most extreme data points not considering outliers.

