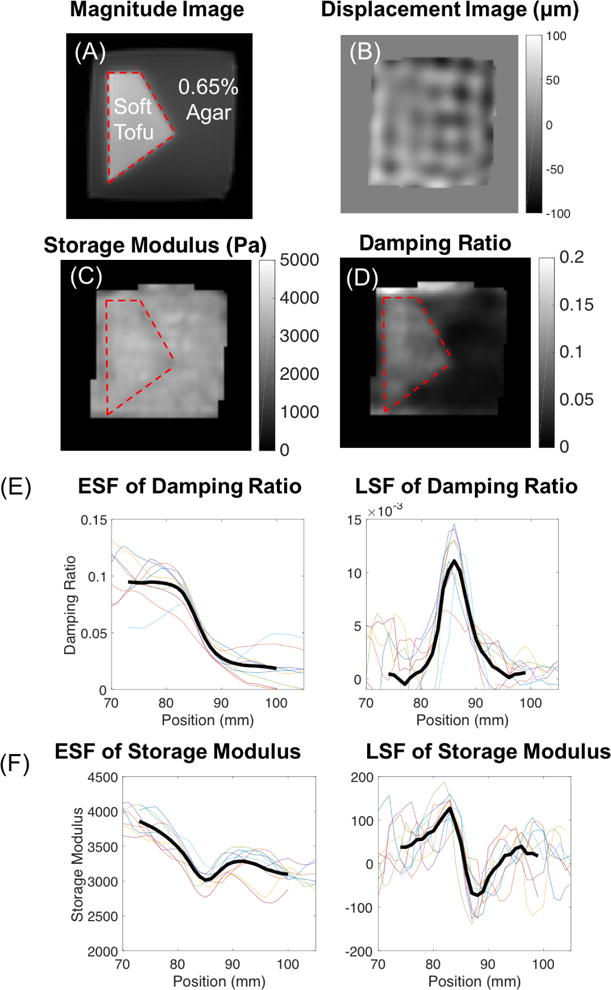
Figure 7.

(A) Magnitude image, (B) displacement image of motion in the Z direction, (C) storage modulus, and (D) damping ratio images of the damping ratio interface phantom. Red contour encloses the soft tofu region. ESF and LSF plots from NLI reconstruction of the damping ratio interface phantom for (E) the damping ratio and (F) the storage modulus.
