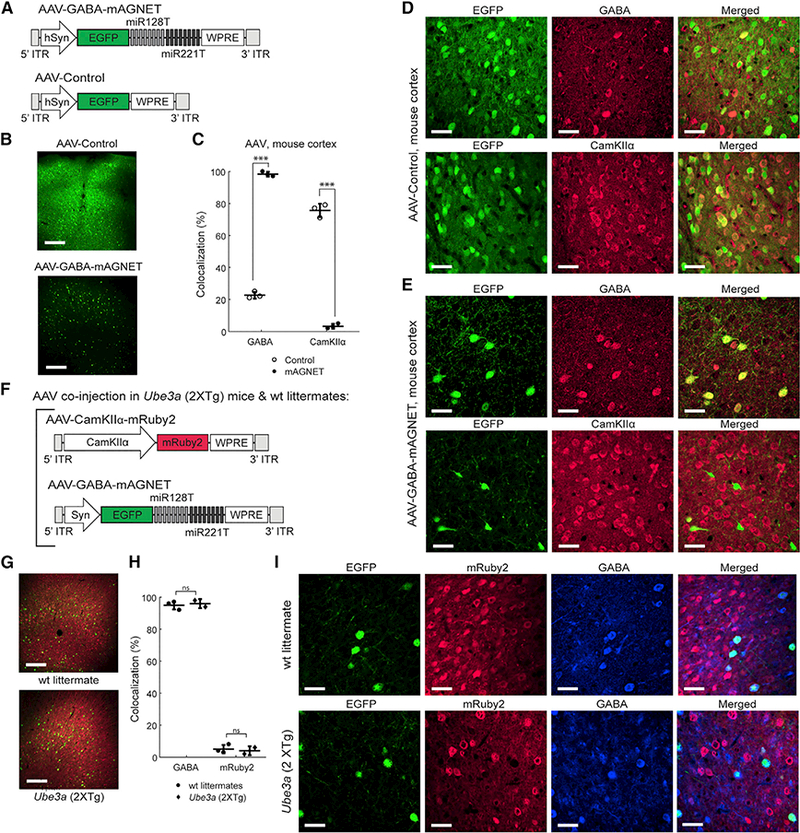
Figure 2. Selective Interneuron Labeling with rAAV2.9 Packaged GABA mAGNET in the Mouse Cortex:

(A) AAV-GABA-mAGNET and AAV-Control vector designs.
(B) Confocal microscopy images showing comparison of AAV transduction in C57bL/6 WT mouse cortex (cortex 1 site). Scale bars, 250 μm.
(C) Colocalization of EGFP+ cells with inhibitory and excitatory marker immune stains in the C57bL/6 WT mouse cortex (n = 3 mice each). Scatterplot shows individual animals (circles) and mean (horizontal bar) ± SD. ***p < 0.005, Pearson’s chi-square test (see Experimental Procedures).
(D-E) Representative confocal images of EGFP+ cortical cells transduced with AAV-Control (D) or AAV-GABA-mAGNET(E), immunofluorescence of inhibitory (GABA) and excitatory (CamKIIα) cell markers, and colocalization. Scale bars, 35 mm.
(F)Co-injected AAV-CamKIIa-mRuby2 and AAV-GABA-mAGNET viral vector designs.
(G) Confocal microscopy images showing cells transduced by AAV-CamKIIα-mRuby2 (red) and AAV-GABA-mAGNET (green) in the cortex (cortex 1 site) of a Ube3a (2xTg) autism model mouse versus FVP WT littermate. Scale bars, 250 μm.
(H) Colocalization of EGFP+ cells (transduced by AAV-GABA-mAGNET) with GABA immunofluorescence or mRuby2 (transduced by AAV-CamKIIα-mRuby2) in Ube3a (2xTg) mice (n = 2) and WT littermates (n = 3). Scatterplot shows individual animals (circles) and mean (horizontal bar) ± SDns = no significance, Pearson’s chi-square test.
(I) Representative confocal images ofEGFP+ cortical cellstransduced with AAV-GABA-mAGNET, mRuby2 fluorescencefrom cortical cellstransduced with AAV CamKIIα mRuby2, immunofluorescence of an inhibitory (GABA) cell marker, and colocalization from a Ube3a (2xTg) mouse (bottom) and WT littermate (top). Scale bars, 35 μm.
See also Figures S1 and S2 and Tables S1 and S2.
