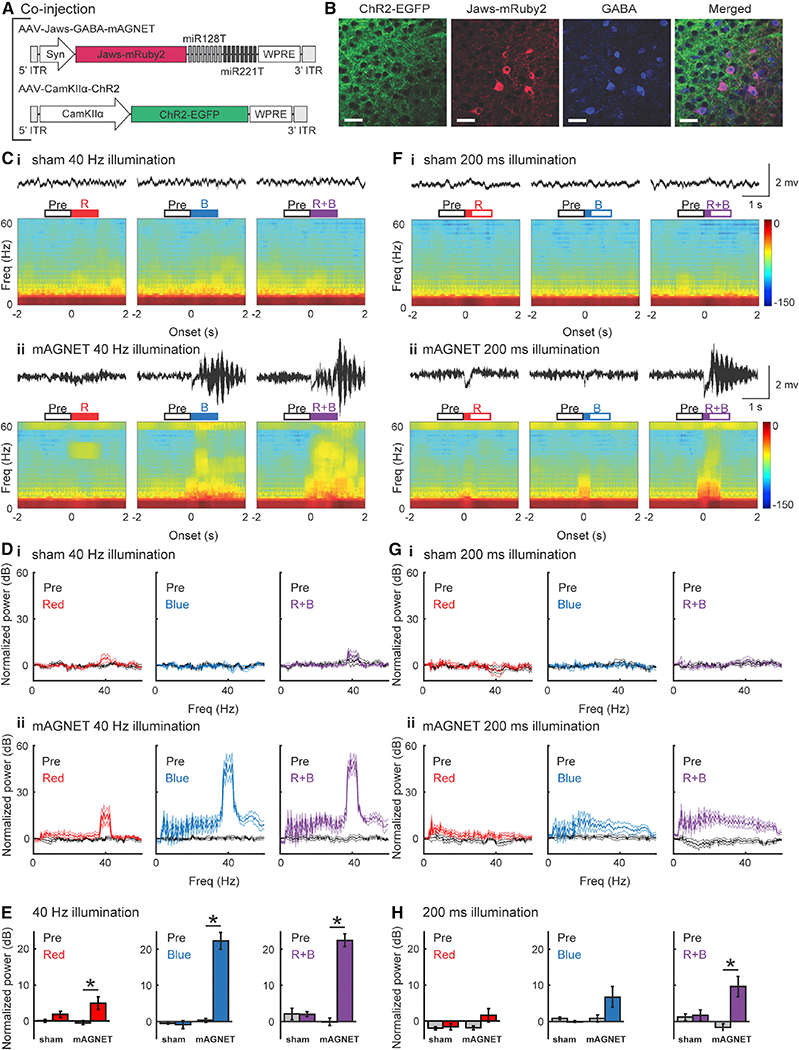
Figure 4. Simultaneous Optogenetic Manipulation of Two Neuron Subtypes In Vivo with AAV-GABA-Magnet.

(A) AAVvectordesignsto selectively express Jaws-mRuby2 in cortical inhibitory neuronsforsilencing (AAV-Jaws-GABA-mAGNET), and ChR2-EGFP in cortical excitatory neurons for activation (AAV-CamKIIα-ChR2).
(B) Representative confocal images of CHR2-EGFP expression, Jaws-mRuby2 expression, GABA immunostaining, and colocalization. Scale bars, 35 μm.
(C) Examples of local field potential (LFP) recordings and spectrograms from a sham (non-injected, WT) mouse (Ci) and from a mAGNET (virus-injected, WT) mouse (Cii) during 40 Hz pulse train laser illumination. Both LFP trace and spectrogram were aligned to illumination onset. Open boxes above indicate the time window for calculating oscillation power and solid parts indicate illumination duration: pre-illumination (Pre), red laser illumination (R), blue laser illumination (B), and simultaneous red and blue laser illumination (R+B).
(D) Normalized oscillation power during 40 Hz pulse train laser illumination across animals (sham: n = 5, mAGNET: n = 6).
(E) Gamma oscillations (30–50 Hz) induced by 40 Hz pulse train laser illumination with red laser (left), blue laser (middle), or both (right) in sham and mAGNET mice (*p < 0.05, Wilcoxon rank-sum test). Plot shows mean ± SEM.
(F-H) Same as (C-E), for 200 ms pulse laser illumination.
See also Table S2.
