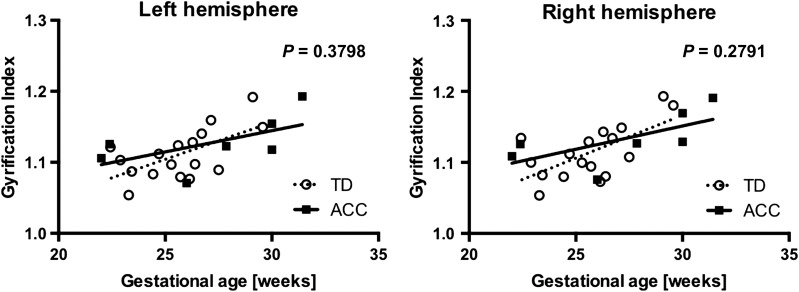
Figure 6.
Developmental trajectory of GI. GI of ACC and TD groups is plotted for each hemisphere as a function of gestational age to compare the developmental trajectory of gyrification. Linear regression models of GI as a function of gestational age did not find significant differences between ACC (solid) and TD (dotted) groups.

