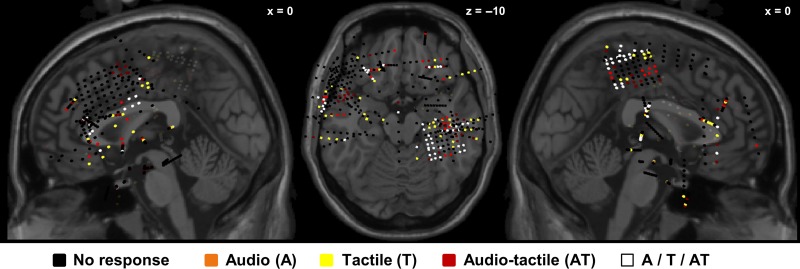
Figure 1.
Locations of all recording sites in 3D MNI space. MNI coordinates of electrodes from all 6 patients (500 electrodes in total) plotted on the Colin27 MRI template (on selected sagittal and axial planes). Note that locations are in 3D MNI space, and not located on the surface of MRI slice shown (thus, recording sites behind the depicted MRI slice are marked with faded color). In black, the implanted electrodes not showing a response (vs. baseline, cluster-corrected) to stimuli, in orange, the electrodes showing a response to audio stimuli only, in yellow, the electrodes showing a response to tactile stimuli only, in red, the electrodes showing a response to audio-tactile stimuli, and in white the electrodes showing a response to at least 2 conditions.

