
Figure 2.
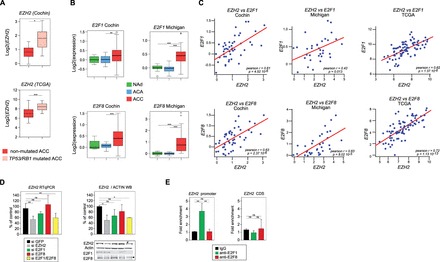
Expression of EZH2 is downstream of P53/RB/E2F in ACC. (A) EZH2 expression is higher in patients with inactivating mutations in TP53/RB1. Patients from Cochin and TCGA cohorts were separated in two groups based on the presence or absence of inactivating mutations in either TP53 or RB1 and relative expression levels of EZH2 were calculated from micro-array and RNA seq data. Significance of the differential expression was evaluated by Student’s t test. (B) E2F1 and E2F8 are up-regulated in ACC. Boxplots represent the expression levels of E2F1 and E2F8 in NAd (green), ACA (blue) and ACC (red), from two independent cohorts (Cochin and Michigan) (C) Expression of EZH2 is correlated with expression of E2F1 and E2F8. Pearson correlation between log2 values of EZH2 expression and expression of E2F1 and E2F8 genes in ACC from Cochin, Michigan and TCGA cohorts. P, P-value; r, Pearson correlation coefficient. (D) Effect of E2F1 and E2F8 knockdown on EZH2 expression in H295R cells. H295R cells were transfected with siRNAs targeting GFP (negative control), EZH2, E2F1, E2F8 or both E2F1 and E2F8. After 5 days, expression levels of EZH2, E2F1 and E2F8 were determined by RTqPCR (EZH2, left panel) and western blot (EZH2, E2F1, E2F8, right panel). Bars represent the mean of at least four experiments performed in triplicate ± SD. (E) Analysis of E2F1 and E2F8 recruitment on EZH2 promoter. Recruitment of E2F1 and E2F8 on EZH2 promoter in H295R cells was evaluated by ChIP with E2F1 and E2F8 antibodies. Bars represent the mean of RTqPCR quantification of three independent ChIP experiments ± SD. These were obtained with primers within EZH2 promoter, surrounding four putative E2F response elements (EZH2 promoter) (19) or with primers within EZH2 coding region (negative control).