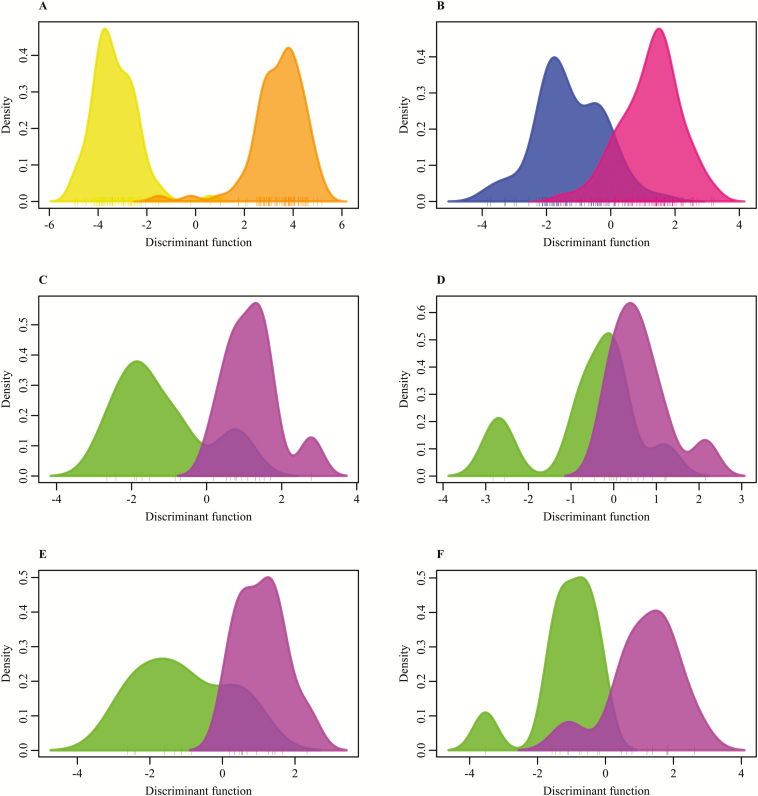
Figure 3.
Gaussian kernel density estimation of the discriminant function as a result of the discriminant analysis of principle components for tested groups based on operational taxonomic units. (A) Diet. Yellow = corn/soybean meal diet, orange = wheat/barley/by-products diet. (B) Sex. Blue = male pigs, pink = female pigs. (C–F) Feed efficiency. Green = high feed efficiency, purple = low feed efficiency. (C) Male pigs fed a corn/soybean meal diet, (D) female pigs fed a corn/soybean meal diet, (E) male pigs fed a wheat/barley/by-products diet, and (F) female pigs fed a wheat/barley/by-products diet.

