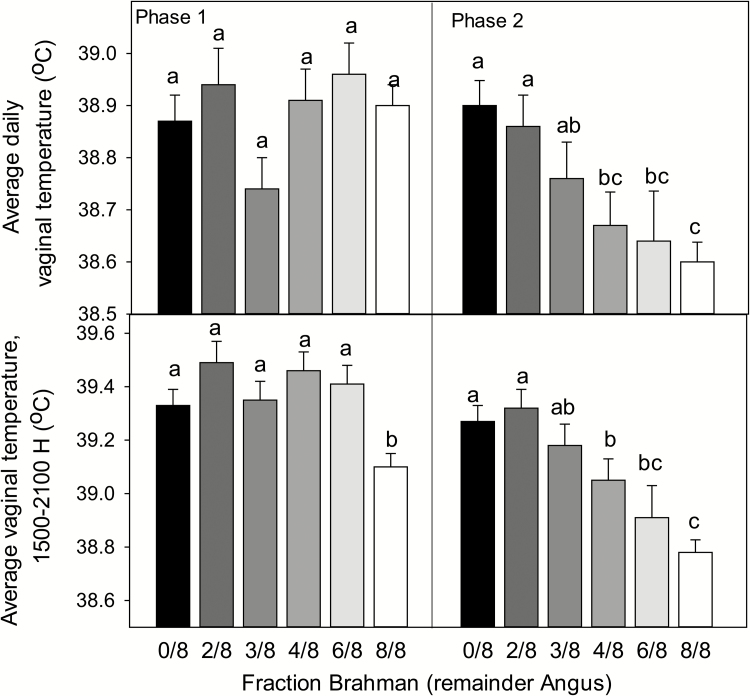
Figure 4.
Effect of genetic group on average daily vaginal temperatures and average vaginal temperatures from 1500 to 1900 h in phase 1 (replicates 1 and 2) and phase 2 (replicates 3 and 4). Average daily vaginal temperatures were affected by genetic group (P = 0.0162), phase (P < 0.0001), and the interaction between genetic group and phase (P = 0.0015). Average vaginal temperatures from 1500 to 1900 h were affected by genetic group (P < 0.0001), phase (P < 0.0001), and the interaction between genetic group and phase (P = 0.0374). Means with different subscripts differ (P < 0.05).

