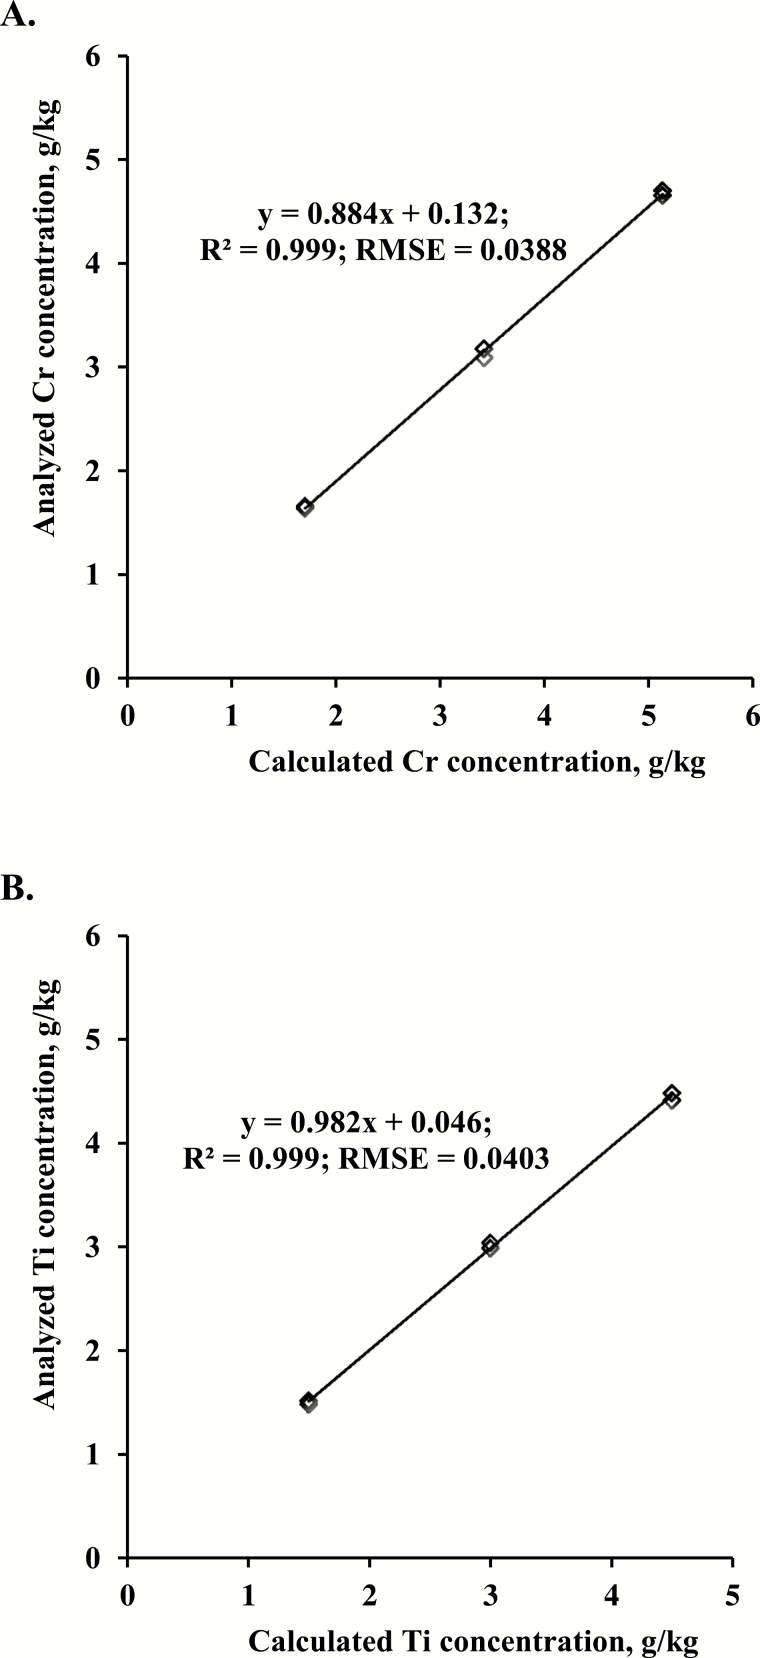
Figure 1.
The regression analysis between analyzed and calculated Cr (A) and Ti concentrations (B) in experimental diets. Each point represents the mean value of duplicated measurements. The chromic oxide and titanium dioxide were included at 2.5, 5.0, and 7.5 g/kg in experimental diets. RMSE = root of mean square error.

