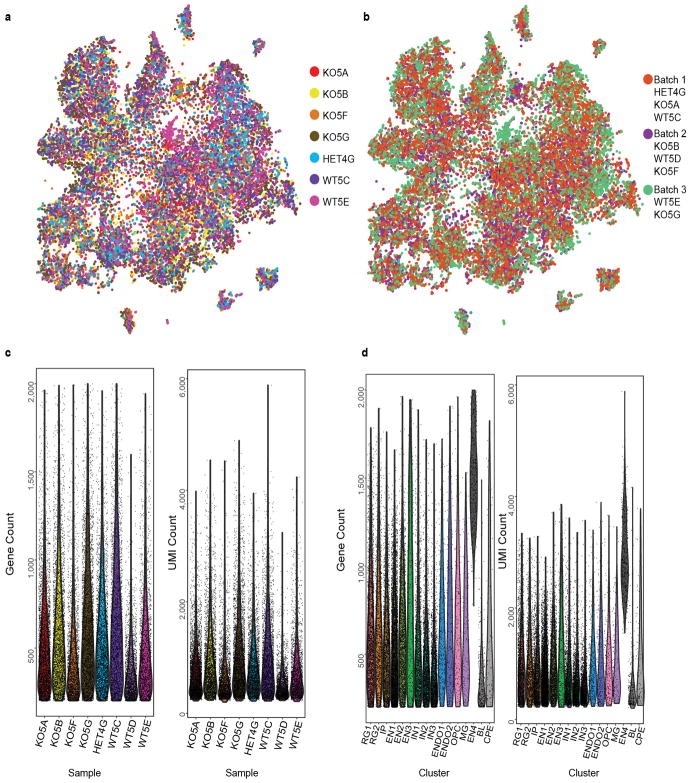
Extended Data Figure 7. Single-cell RNA-seq batch, sample, and cluster analyses.
a, tSNE plot from Fig. 3a with cells colored by biological replicate (i.e., animal). Most clusters include cells from all samples, except for a cluster expressing blood genes and a cluster expressing choroid plexus epithelial cells that are mostly from animal WT5E. These two cell clusters were not included in the downstream analysis. b, tSNE plot from Fig. 3a with cells colored by the batch they were processed in. Clusters are composed of cells from all batches. c, Per cell gene count and unique molecular identifier (UMI) count per sample. Each violin plot is one biological replicate and each dot is one cell. Sample WT5D was not included in the analysis due to the lower gene and UMI count compared to other samples as well as the inconsistent clustering compared to other WT samples (data not shown). d, Per cell gene count and UMI count for identified clusters. Each violin plot is one cell cluster and each dot is one cell. The three clusters in grey (EN4, BL, CPE) were not included in the downstream analysis. See Methods for details. This scRNA-seq experiment was performed once with n = 22,211 cells (8,037 cells from 2 Aspm+/+ and 1 +/− ferrets, and 14,174 cells from 4 Aspm−/− ferrets). RG1, cycling radial glial progenitors; RG2, interphase radial glial progenitors; IP, intermediate progenitors; EN1, upper-layer excitatory neurons; EN2, deep-layer excitatory neurons; EN3, Cajal-Retzius cells; IN1, immature inhibitory neurons; IN2, SST+ inhibitory neurons; IN3, ventral/inhibitory progenitors; ENDO1, endothelial cells 1; ENDO2, endothelial cells 2; OPC, oligodendrocyte precursors; MG, microglia; EN4, mixed excitatory neuron identity; BL, blood cells; CPE, choroid plexus epithelial cells.

