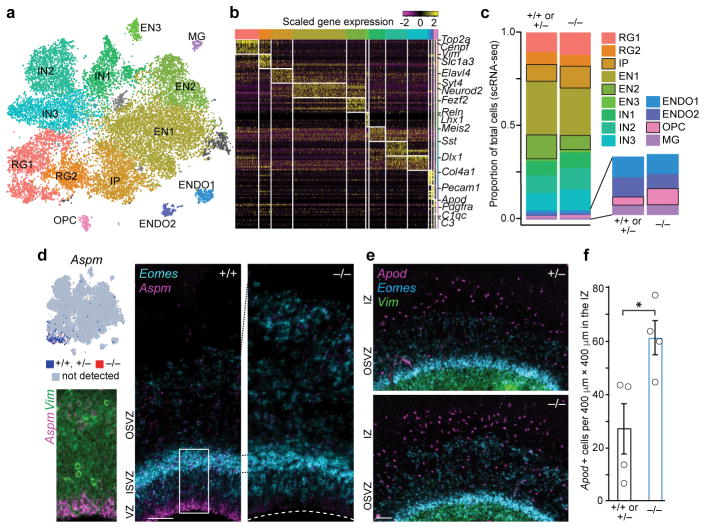
Figure 3. Loss of Aspm changes cell type proportions but not transcriptional programs.
a, scRNA-seq identifies major cell types at E35. (For abbreviations and statistics, see Extended Data Table 2.) b, Cell type markers for each cluster. c, Proportions of each cell type, with the largest changes indicated by black outlines (bootstrap FDR < 0.01). d, Aspm is enriched at the VZ apical surface; Eomes+ IP are increased in the KO SVZ. e,f, Apod+ OPC are increased in Aspm−/− ferrets (*, P = 0.012 by one-tailed t-test; n = 4 animals/genotype). See Methods for statistics and reproducibility. The graph shows mean ± s.e.m. Asterisks in d, blood vessels. Scale bars: 100 μm.

