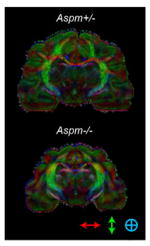
Extended Data Table 1. Region-specific changes in volume and surface area by loss of Aspm in ferrets.
a, Multiple brain regions are significantly decreased in volume with most reduction in the frontal cortex of adult Aspm−/− ferrets (n = 3 per genotype). Subcortical regions are relatively preserved. b, Outer cortical surface is most reduced in the frontal cortex followed by the lateral cortex. The parietal/occipital cortex is also decreased but the difference is not as significant. The medial cortex shows no discernible decrease. c, d, DTI shows that the orientation of white matter tracts or connectivity is fundamentally unchanged in Aspm KO ferrets except in the frontal cortex, which show a modest decrease in fractional anisotropy (d). The directional map (c) shows white matter orientation with red, green, and blue indicating the medial-lateral, superior-inferior, and anterior-posterior components respectively. Statistical analysis was performed by two-tailed t-test. Mean ± s.e.m.
| a | |||
|---|---|---|---|
| Volume (mm3)
| |||
| Region | Aspm+/− | Aspm−/− | P-value |
| Frontal ctx | 475.0 ± 58.4 | 235.0 ± 11.0 | 0.0156 |
| Corpus callosum | 79.3 ± 6.7 | 40.3 ± 2.3 | 0.0048 |
| Lateral ctx | 666.9 ± 48.4 | 364.8 ± 33.9 | 0.0069 |
| Ctx WM | 701.4 ± 46.1 | 402.9 ± 19.0 | 0.0039 |
| Parietal/occipital ctx | 421.6 ± 17.5 | 256.6 ± 17.5 | 0.0026 |
| Medial ctx | 639.4 ± 58.5 | 397.3 ± 14.3 | 0.0159 |
| Hippocampus | 319.7 ± 49.8 | 208.4 ± 18.5 | 0.0136 |
| Caudate | 113.9± 13.3 | 74.8 ± 4.5 | 0.0478 |
| Putamen | 14.3 ± 0.9 | 10.1 ± 0.4 | 0.0147 |
| Thalamus | 239.7 ± 18.5 | 172.4 ± 3.4 | 0.0238 |
| Cerebellum GM | 895.0 ± 32.0 | 650.3 ± 20.7 | 0.0030 |
| Cerebellum WM | 182.5 ± 12.1 | 141.5± 6.2 | 0.0382 |
| Brainstem GM | 263.8 ± 23.1 | 207.0 ± 8.4 | 0.0836 (NS) |
| Brainstem WM | 149.8 ± 6.5 | 121.3 ± 5.7 | 0.0298 |
| Midbrain WM | 43.2 ± 0.6 | 37.3 ± 0.8 | 0.0018 |
| Amygdala | 23.2 ± 1.1 | 20.2 ± 1.4 | 0.1868 (NS) |
| Midbrain GM | 106.0 ± 3.2 | 101.8 ± 2.6 | 0.3146 (NS) |
| b | |||
|---|---|---|---|
| Outer surface area
(mm2) | |||
| Region | Aspm+/− | Aspm−/− | P-value |
| Cerebral ctx (total) | 1,225.4 ± 64.1 | 933.0 ± 47.5 | 0.0217 |
| Frontal ctx | 309.6 ± 18.5 | 203.5 ± 2.8 | 0.0048 |
| Lateral ctx | 391.9 ± 18.5 | 301.4 ± 20.5 | 0.0305 |
| Parietal/occipital ctx | 298.4 ± 20.1 | 217.1 ± 22.7 | 0.0551 (NS) |
| Medial ctx | 225.5 ± 9.7 | 211.0 ± 9.5 | 0.3476 (NS) |
| c |
|---|

|
| d | |||
|---|---|---|---|
| Fractional anisotropy
| |||
| Region | Aspm+/− | Aspm−/− | P-value |
| Frontal ctx | 0.272 ± 0.002 | 0.240 ± 0.007 | 0.0130 |
| Medial ctx | 0.255 ± 0.004 | 0.237 ± 0.009 | 0.1377 (NS) |
| Lateral ctx | 0.253 ± 0.011 | 0.252 ± 0.008 | 0.9198 (NS) |
| Parietal/occipital ctx | 0.267 ± 0.014 | 0.246 ± 0.014 | 0.3421 (NS) |
| Ctx WM | 0.431 ± 0.031 | 0.379 ± 0.018 | 0.2285 (NS) |
| Corpus callosum | 0.487 ± 0.034 | 0.434 ± 0.048 | 0.4170 (NS) |
| Cingulum | 0.415 ± 0.063 | 0.342 ± 0.053 | 0.4267 (NS) |
| Fornix | 0.458 ± 0.041 | 0.435 ± 0.022 | 0.6542 (NS) |
| Anterior commisure | 0.437 ± 0.069 | 0.336 ± 0.052 | 0.3046 (NS) |
| Optic tract | 0.523 ± 0.059 | 0.435 ± 0.045 | 0.3013 (NS) |
| Corticospinal tract | 0.550 ± 0.059 | 0.470 ± 0.041 | 0.3330 (NS) |
| Brainstem WM | 0.501 ± 0.042 | 0.423 ± 0.026 | 0.1925 (NS) |
| Cerebellum WM | 0.454 ± 0.031 | 0.368 ± 0.033 | 0.1321 (NS) |
| Midbrain WM | 0.398 ± 0.058 | 0.338 ± 0.043 | 0.4496 (NS) |
| Cerebellum GM | 0.301 ± 0.010 | 0.258 ± 0.007 | 0.0211 |
| Brainstem GM | 0.353 ± 0.011 | 0.285 ± 0.015 | 0.0230 |
| Inferior colliculus | 0.289 ± 0.001 | 0.276 ± 0.009 | 0.2078 (NS) |
| Superior colliculus | 0.270 ± 0.008 | 0.262 ± 0.008 | 0.4870 (NS) |
| Periaqueductal gray | 0.273 ± 0.010 | 0.268 ± 0.003 | 0.6517 (NS) |
| Midbrain GM | 0.291 ± 0.017 | 0.270 ± 0.015 | 0.3974 (NS) |
| Thalamus | 0.286 ± 0.015 | 0.269 ± 0.003 | 0.3413 (NS) |
| Hippocampus | 0.270 ± 0.011 | 0.254 ± 0.002 | 0.2276 (NS) |
| Hypothalamus | 0.257 ± 0.021 | 0.225 ± 0.011 | 0.2533 (NS) |
| Globus pallidus | 0.291 ± 0.020 | 0.288 ± 0.021 | 0.9115 (NS) |
| Putamen | 0.285 ± 0.007 | 0.292 ± 0.023 | 0.7631 (NS) |
| Caudate | 0.216 ± 0.005 | 0.221 ± 0.013 | 0.7161 (NS) |
| Septum | 0.267 ± 0.022 | 0.245 ± 0.010 | 0.4183 (NS) |
| Amygdala | 0.206 ± 0.013 | 0.213 ± 0.019 | 0.7790 (NS) |
