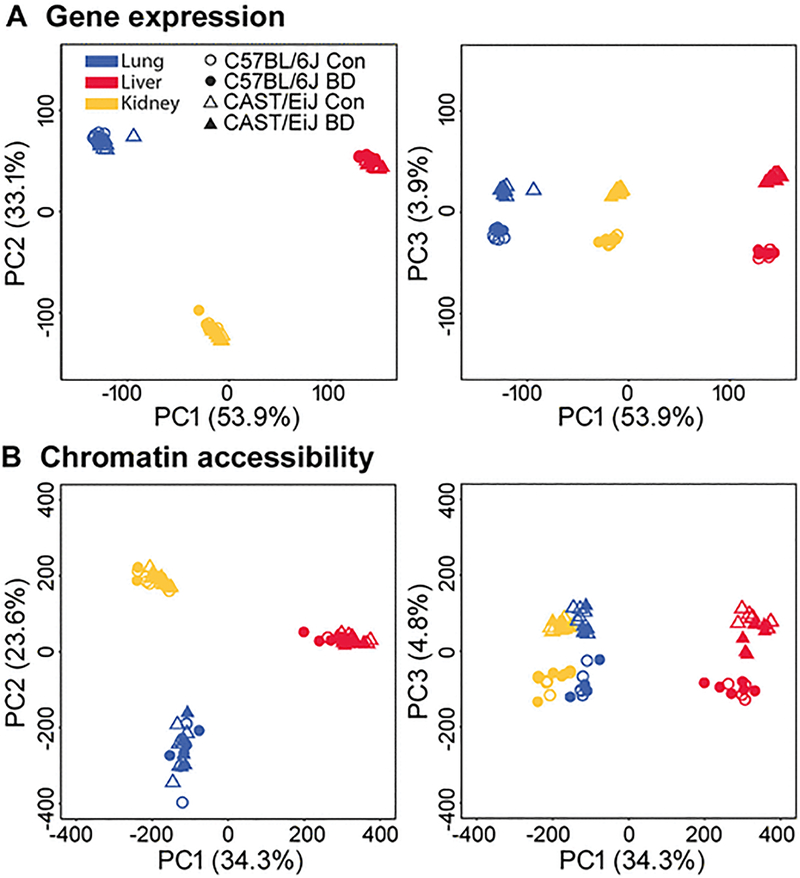
Figure 2. Principal component (PC) analysis of normalized gene expression (A) and chromatin accessibility data (B).
For both datasets, PC1 and PC2 clearly separate lung (blue), liver (red) and kidney (yellow) samples, whereas PC3 separates CAST/EiJ (triangle) from C57BL/6J (circle) samples. In contrast to tissue and strain, treatment status did not significantly contribute to the overall variation observed in either gene expression or chromatin accessibility data.

