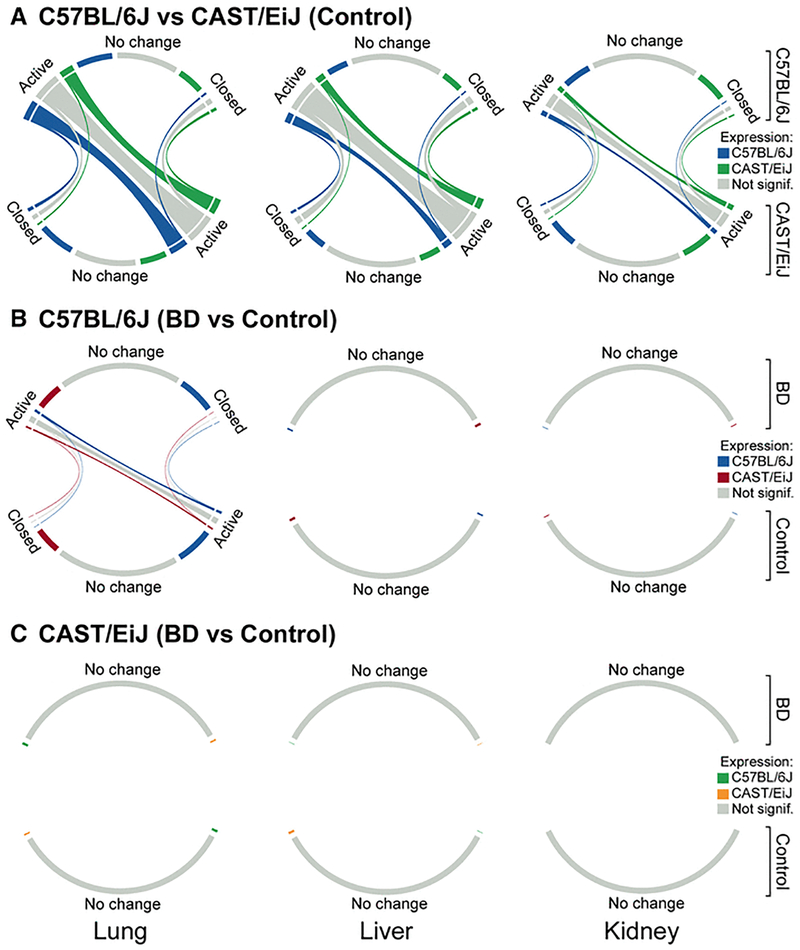
Figure 3. Chord diagrams of chromatin state transitions between CAST/EiJ and C57BL/6J at baseline (A) and between control and exposed C57BL/6J (B) and CAST/EiJ (C) mice.
For each chord diagram, the size of the outer segments represents the number of individual chromatin regions classified as either “active”, “closed”, or “no change”. These are further sub-divided into 3 groups based on the direction of expression change for genes associated with those chromatin regions. The size of the ribbons between segments represents the number of chromatin regions undergoing a transition from one state to another. Segments and ribbons are colored according to the direction of expression change. For the number of regions within a particular state, see Supplemental Table 5.

