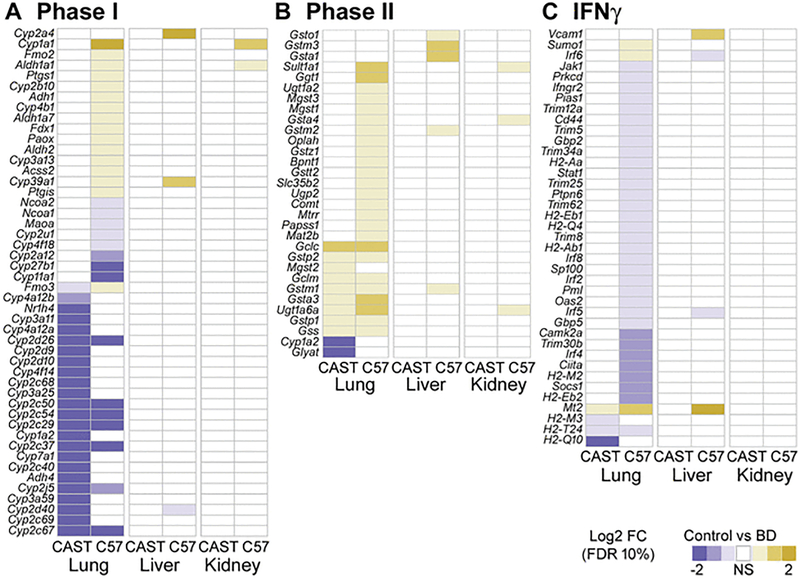
Figure 5. Heat maps of gene expression (log2 fold-change) for genes involved with Phase I metabolism (A), Phase II metabolism (B) and IFNγ signaling (C) across all tissues and strains at in response to butadiene exposure.
Within each heat map, genes are ordered by the first column. Only genes that were significantly differentially expressed in a given contrast (FDR<10%) are depicted in the relevant color scale. Non-significant expression differences are represented in white.

