
Fig 2.
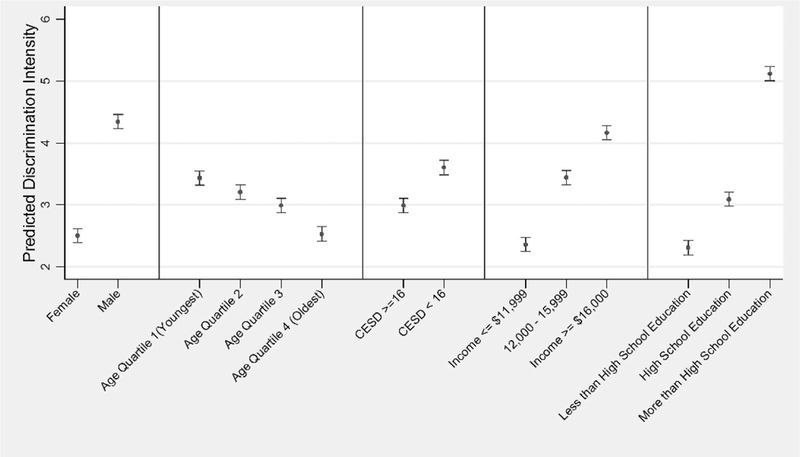
Overall reported discrimination intensity for 636 African Americans enrolled in Medicare managed care within the Deep South. Values represent the predicted joint estimates of discrimination intensity taken as the product of the predicted probablity of any discrimination and the predicated intensity of discrimination from a zero-inflated negative binomial model with the Experience of Discrimination score (range 0–35) as the outcome. All variables in this graph were entered as independent variable. Non-parametric P values for trend across each category were all <.01