
Fig. 14.
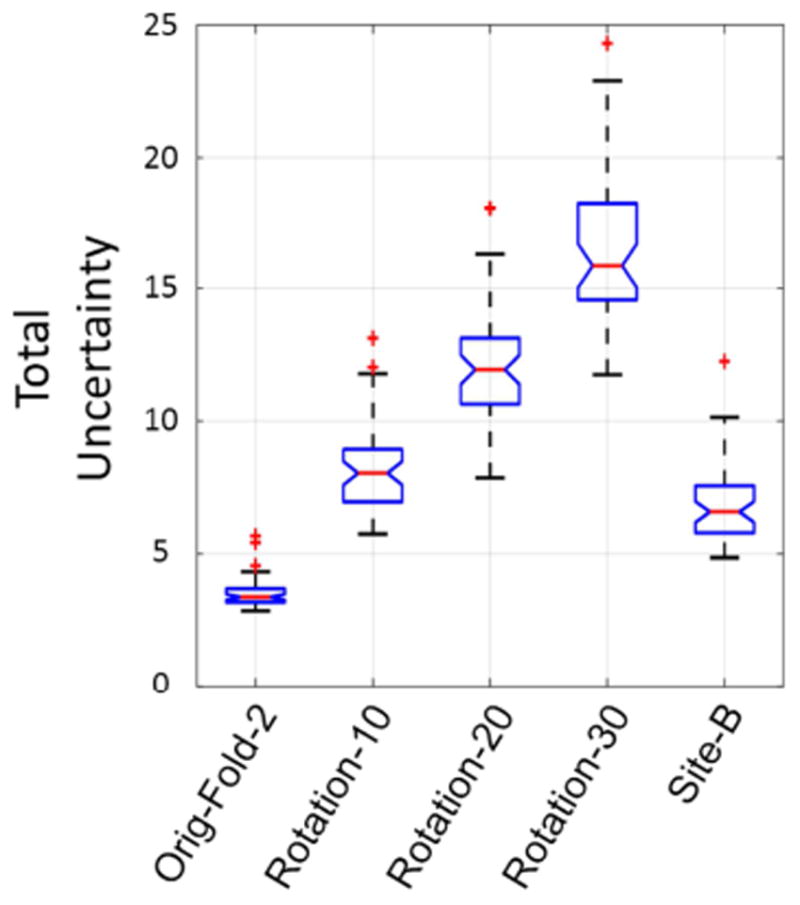
Total uncertainty generated by Bayesian SegNet for the original fold 2 data, rotated fold 2 data and data from another site in boxplots. In the figure points are drawn as outliers with red ‘+’ symbols, if they are greater than q3+1.5(q3-q1) or less than q1-1.5(q3-q1), where q1 and q3 are the first and third quartiles respectively.