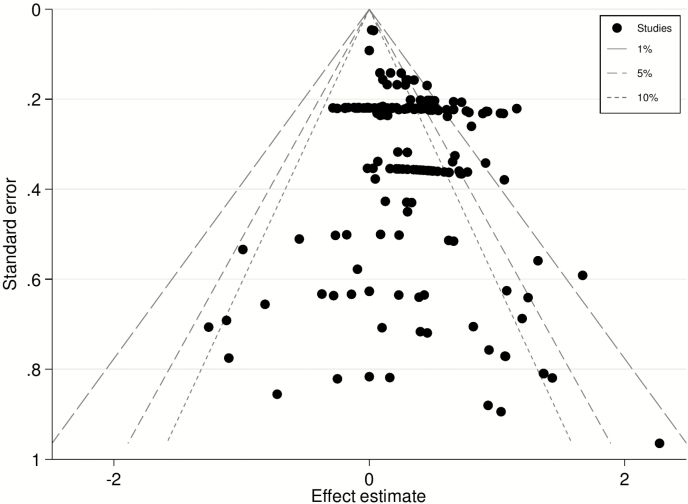
Figure 1.
Contour-enhanced funnel plot showing the effect estimate for HGPs on the difference in WBSF (kg) of primarily the Longissimus dorsi muscle in beef cattle against the SE of that estimate (y-axis). The gray broken lines represent the 90%, 95%, and 99% CI for treatment comparisons. Effect estimates from small studies will scatter more widely at the bottom of the graph and the spread narrows for larger treatments (Sterne and Harbord, 2004). In the absence of heterogeneity or bias the plot should approximately resemble a symmetrical (inverted) funnel with studies lying within these lines. If there is bias, for example, because smaller treatments without statistically significant effects remain unpublished, this will lead to an asymmetrical appearance of the funnel plot and a gap will be evident in a bottom corner of the graph.

