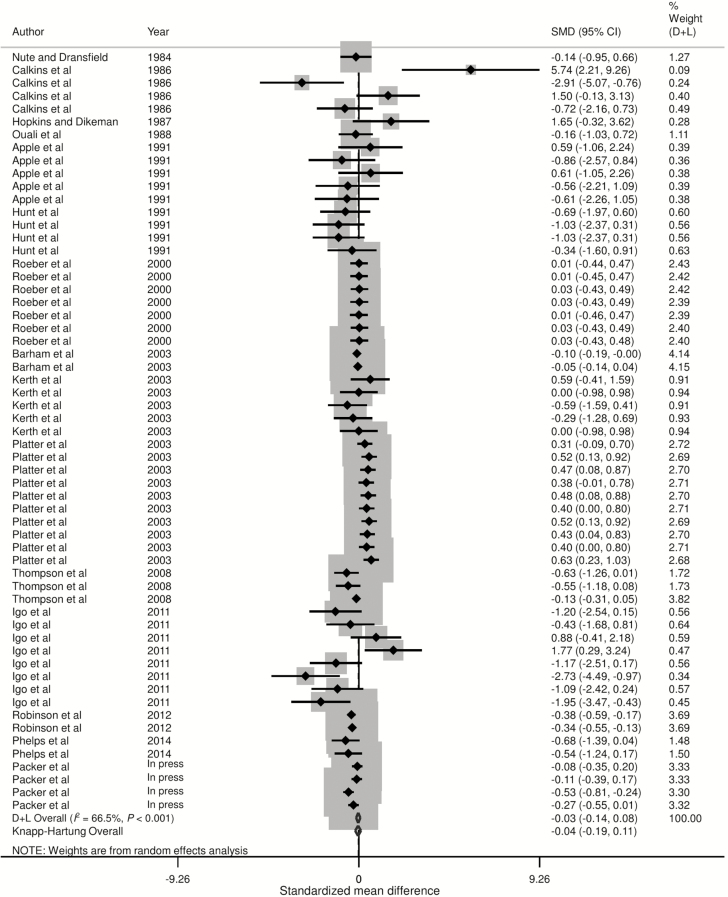
Figure 3.
Forest plot of the ES or SMD (standardized using the z-statistic) and 95% CI of the effect of hormonal growth promotants on juiciness of primarily the Longissimus dorsi muscle in beef cattle. The solid vertical line represents a mean difference of zero or no effect. Points to the left of the line represent a decrease in juiciness, while points to the right of the line indicate an increase. Each square around the point effect represents the mean ES for that treatment comparison and reflects the relative weighting of the treatment comparison to the overall ES estimate. The larger the box, the greater the treatment comparison contribution to the overall estimate. The weight that each treatment comparison contributed is in the right-hand column. The upper and lower limit of the line connected to the square represents the upper and lower 95% CI for the ES. The overall pooled effects size or SMD and 95% CI pooled using the DerSimonian and Laird (D + L; DerSimonian and Laird, 1986) and Knapp–Sidak–Jonkman (Knapp–Hartung; IntHout et al., 2014) methods for random effects models are indicated by the respective diamonds at the bottom. The heterogeneity measure, I2 is a measure of variation beyond chance among treatments included in the meta-analysis. The effect of HGP treatment on juiciness was moderately heterogeneous as indicated by the I2 of 66.5%.

