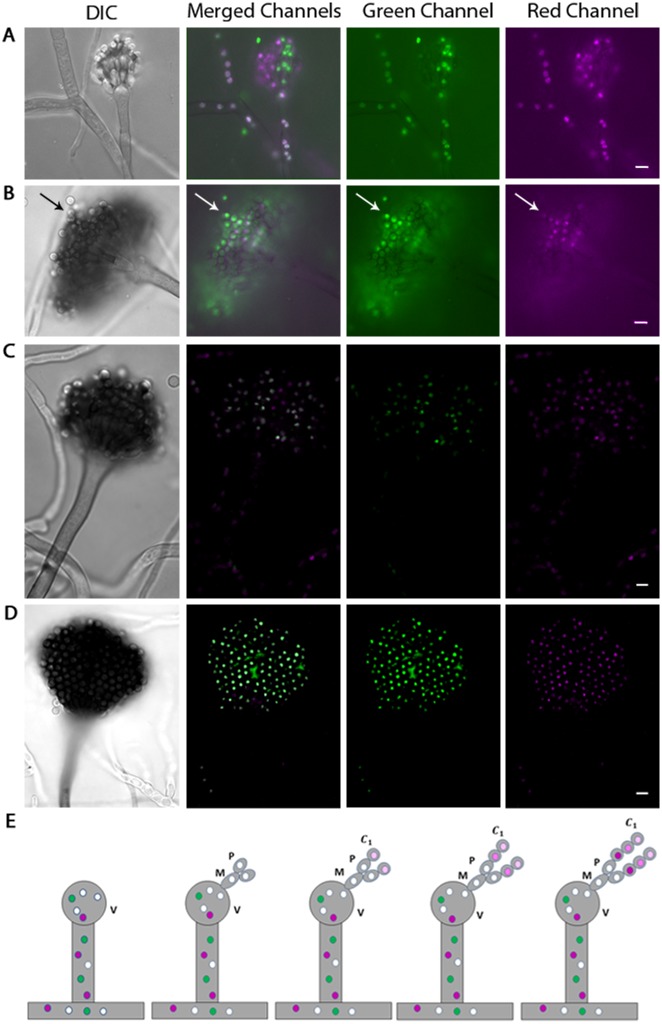
Fig 4. Conidiophores show a heterogeneous mixture of histone H1 protein as conidia develop.
(A-D) Conidiophores derived from a heterokaryon fusion of H1GFP and H1RFP-containing strains imaged in DIC, merged, green, and red channels respectively. (D) Conidiophores derived from a heterokaryon fusion of H1GFP and H1RFP-containing strains which were selected for stable diploid colonies. (E) A postulated model of the histone H1 distribution within a single conidiophore derived from a heterokaryon fusion of histone H1-GFP and H1-RFP-containing strains (V = Vesicle, M = Metula, P = Phialide, C1 = First Conidium). Small colored circles in model represent nuclei; magenta and green circles represent nuclei with fluorescent signal from only histone H1-RFP or H1-GFP respectively. White circles represent nuclei showing a colocalization of fluorescent signal from histone H1-RFP and H1-GFP; all other circle colors represent a heterogeneous composition of fluorescent signals. The progression of darker shades of magenta nuclei within each newly-formed conidium in panel E represents the dilution of exogenous histone H1 protein (H1-GFP) relative to endogenous H1 protein (H1-RFP) as conidiogenesis occurs. All DIC micrographs were imaged in single focal plane. Panels A-B imaged in a single focal plane using a Zeiss Axioplan microscope. Panels C and D are a maximum projection of multiple Z-stack images, captured on a Zeiss LSM 510 VIS/META confocal microscope. White arrow indicates a chain of conidia showing heterogeneous mixture of histone H1-GFP and H1-RFP. White scale bars = 5μm.

