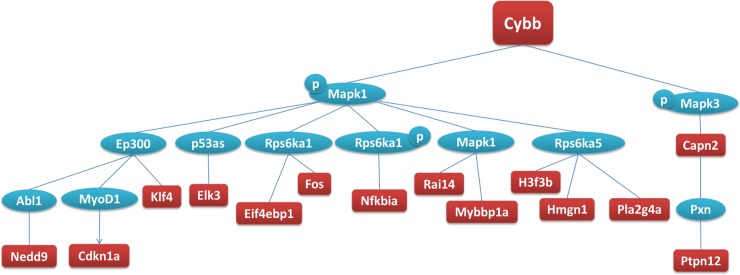
Fig 3. Schematic representation of the network of downstream molecules regulated by Cybb at 24h.
The analysis was performed using the “Master regulators in networks (TRANSPATH®)” workflow (geneXplain 2.2 web edition) (thresholds: Score >0.2 and Z-Score >1), for all the significantly changed transcripts detected by microarrays in KA- versus saline-injected hippocampi at 24h (SAM analysis, thresholds: fold change > |2|, FDR = 0%, n = 9/time-point/treatment). Red: genes overexpressed at 24h, blue: genes not significantly changed, p: phosphorylation.

