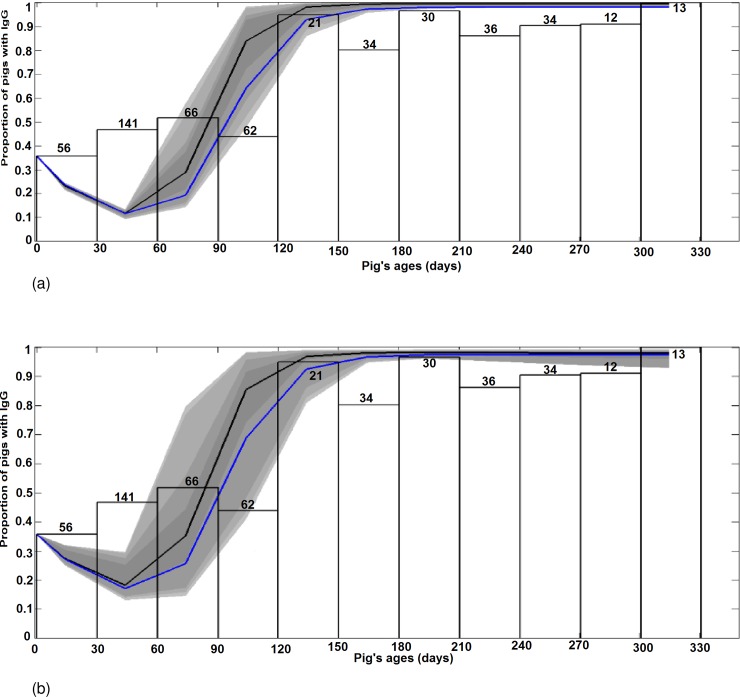
Fig 3. Results of model fitting: Variation of the proportion of seropositive pigs (maternally derived antibodies or natural infection) as predicted by VM and VDM when fitted to the CS serological data.
(a) VM fits CS. (b) VDM fits CS. The y-axis is the proportion of pigs with IgG from maternal or infectious origins. The x-axis is the distribution of the proportion of seropositive pigs by age-class. The total number of individuals of each age-class is given on top of each corresponding white bar. The blue line represents the best fit. The black line shows the median fit. Grey areas with decreasing color intensity correspond to the 99%, 97%, 95% and 50% posterior limits of model uncertainty in predicting new observations.

