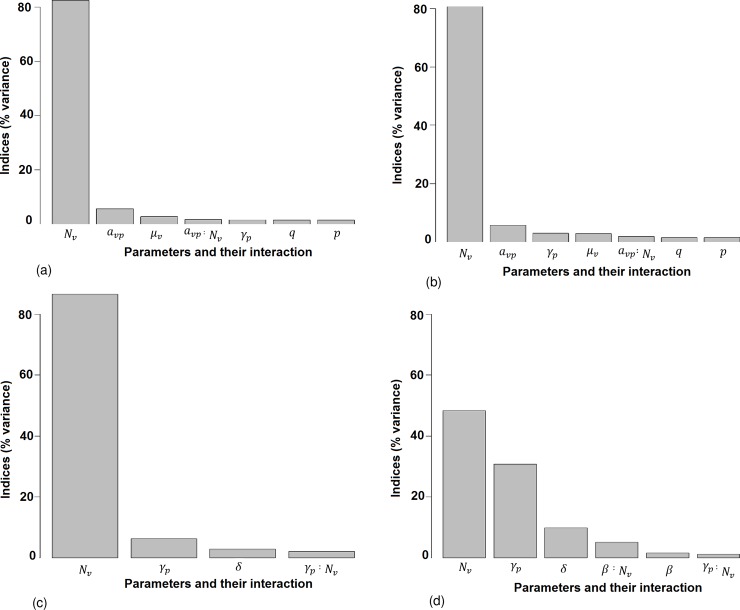
Fig 4. Results of the sensitivity analysis of R0 and Ipmax for models VM and VDM.
(a) R0 for VM. (b) R0 for VDM. (c) Ipmax for VM. (d) Ipmax for VDM. The y-axis represents the percentage of the total variance explained by the variation of the parameters alone, or the interaction of two parameters. The parameters are ranked in decreasing order of the sensitivity indices, i.e. from the most to the least influential. We present only parameters responsible for more than 1% of the global variance.

