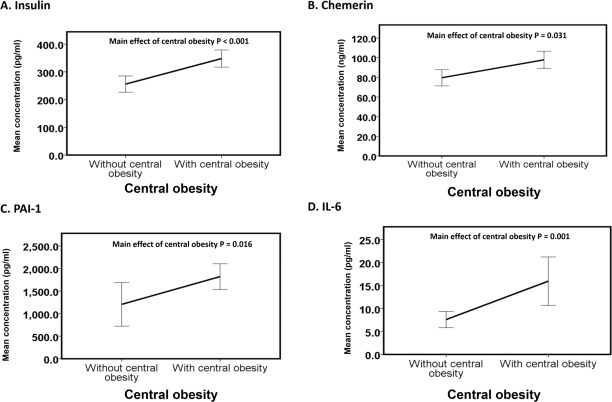
Fig 3. Main effect of obesity on adipokines.
The line graphs (A-D) represent the means of insulin, chemerin, IL-6, and PAI-1 of subjects without central obesity (n = 29) versus subjects with central obesity (n = 54) irrespective of the presence of the clustering of 4 MetS risk factors (high fasting blood glucose, high triglycerides, low HDL and high systolic and diastolic BP). The data are expressed as the mean ± 1 standard deviation. Statistical significance was accepted at P < 0.05.

