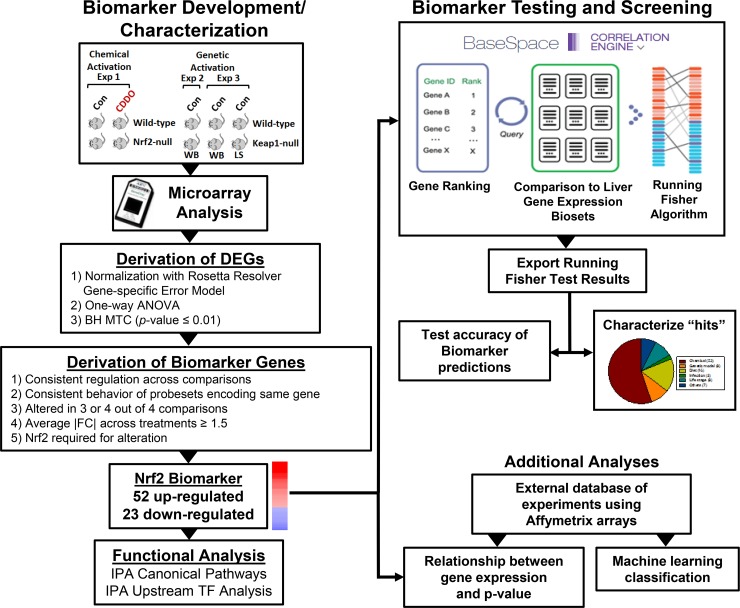
Fig 1. Scheme for Nrf2 biomarker development and characterization for screening of a mouse liver gene expression compendium.
Left, biomarker development and characterization. A number of microarray experiments were used to create the Nrf2 biomarker. Wild-type and Nrf2-null mice were treated with CDDO-Im (experiment 1; [47]). Wild-type and Keap1-null (whole body (WB) or liver-specific (LS)) mice were compared in experiments 2 [47] and 3 [49]. Differentially expressed genes (DEGs) were identified using Rosetta Resolver as indicated. Biomarker genes were identified from the DEGs after applying a number of filtering steps. Genes in the biomarker were evaluated by Ingenuity Pathway Analysis (IPA) for canonical pathway enrichment and potential transcription factor regulators. Right, biomarker testing and screening. The Nrf2 biomarker was imported into the BSCE environment in which protocols rank ordered the genes based on their fold-change. Screening was carried out by comparison of the biomarker to each bioset in the BSCE database using a pair-wise rank-based enrichment analysis (the Running Fisher algorithm). The results of the test including the direction of correlation and p-value of the test for each bioset in the compendium were exported and used to populate a master table containing bioset experimental details. A test of the accuracy of the biomarker predictions was carried out with treatments that are known positives and negatives for Nrf2 activation. Screening “hits” were characterized to determine the factors that modulate Nrf2 activation. Additionally, an external gene expression database of experiments performed with Affymetrix arrays was used in a classification analysis as well as to determine the relationship between expression of Nrf2 biomarker genes and p-values from the Running Fisher algorithm. Part of the Figure was adapted from a Figure in [44] and [40].

