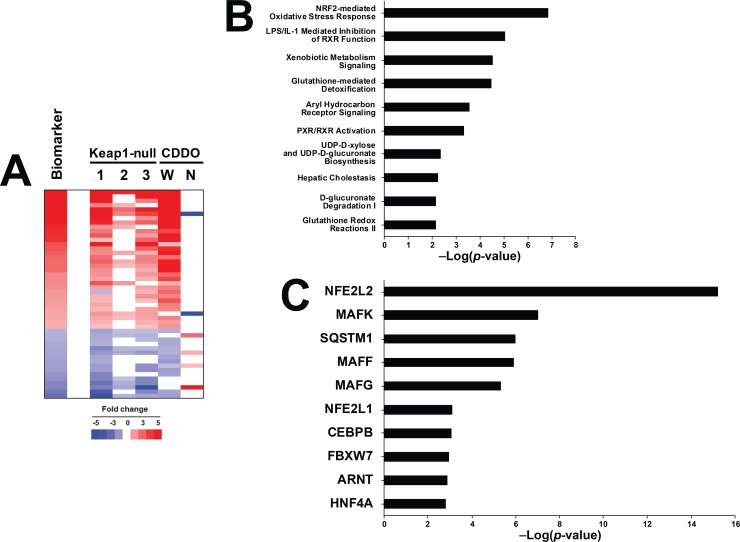
Fig 2. Characterization of a Nrf2 biomarker.
A. The Nrf2 biomarker. (Top) Heat map comparing the expression of the genes in the biosets used to create the biomarker to the Nrf2 biomarker itself. Gene expression profiles from the livers of Keap1-null mice compared to corresponding control wild-type mice (1–3) and from the livers of wild-type (W) or Nrf2-null (N) mice exposed to CDDO-Im (CDDO) for 6 hours. Genes that were similarly regulated by genetic or pharmacological activation of Nrf2 were identified as detailed in the Methods. The biomarker represents the average expression of the genes across the biosets that exhibit genetic or pharmacological activation of Nrf2. The Keap1-null vs. wild-type comparisons were 1) hepatocyte-specific-null (GSE55001), 2) whole body-null (GSE55001), and 3) hepatocyte-specific null (GSE15633). B. Significant canonical pathways represented by the genes in the Nrf2 biomarker. Genes were examined by Ingenuity Pathways Analysis. C. Significant factors predicted to act as upstream regulators of the genes in the Nrf2 biomarker as determined by Ingenuity Pathways Analysis.

