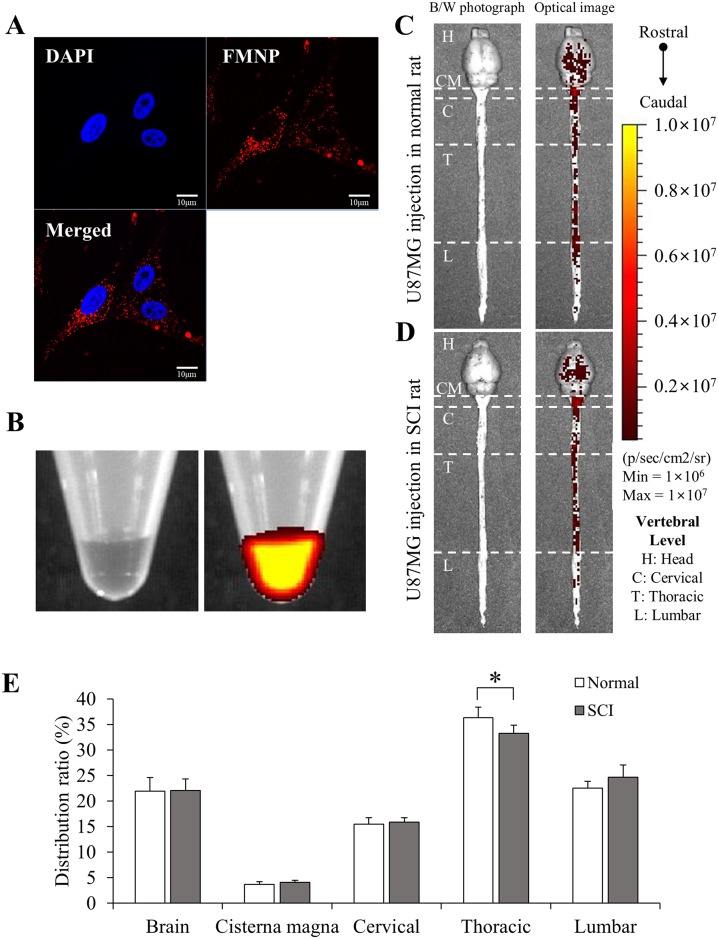
Fig 2. Quantitative in vivo distribution of U87MG cells labelled with FMNP.
(A) Fluorescence (red) of FMNP-labelled U87MG cells was observed under a microscope. DAPI (blue) = nuclei. Scale bar = 10 μm. (B) Fluorescent signals of pellets of 5 × 10⁶ U87MG (left) and FMNP-labelled U87MG (right) were detected by optical imaging. (C and D) 5 × 10⁶ FMNP-labelled U87MG cells in 50 μl HBSS were injected into LVs of rats without (C) or with (D) SCI. Signal intensity was analyzed at 24 hours after injection. The injection was performed at 7 days after SCI for rats with SCI. (E) The distribution ratio of FMNP-labelled U87MG was quantified and compared. Height = Average, Error bar = Standard deviation. *, P < 0.05.

