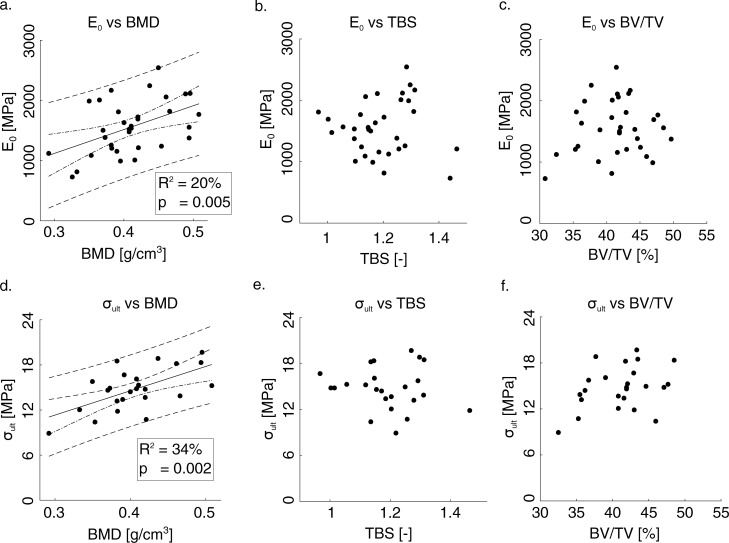
Fig 3. Variation of the elastic stiffness and strength with the BV/TV and other clinical parameters (BMD and TBS).
In the case of significant correlation between each parameter, a linear regression line is specified. R2 = 0.20; p = 0.005 in a) and R2 = 0.34; p = 0.002 in d). The dashed lines are referred to confidence and prediction intervals. Regression lines are added only for significant correlation.

