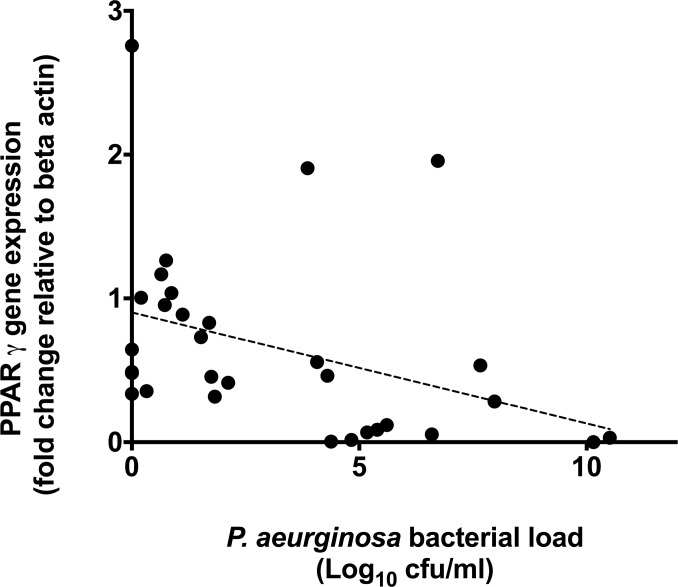
Fig 3. PPARγ gene expression levels (y axis) correlated with P. aeruginosa bacterial load (x axis) as determined by PCR.
There was a significant negative correlation of PPARγ gene expression with P. aeruginosa (r = -0.53, p = 0.002). Points represent individual patient values, dotted line represents the line of best fit.

