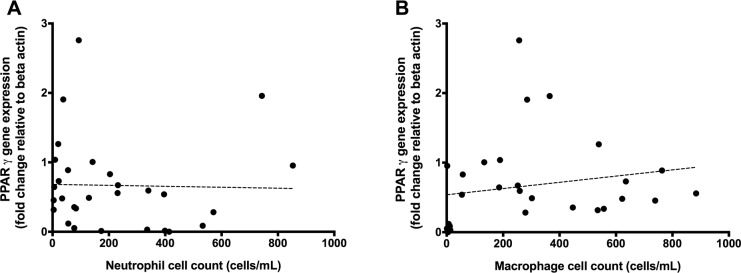
Fig 5.
Correlation between total neutrophil count in induced sputum against relative PPARγ gene expression in BAL-derived cells (panel A (r = -0.19, p = 0.329)). This is compared with the correlation between total macrophage count in induced sputum with relative PPARγ gene expression in BAL-derived cells (panel B (r = 0.38, p = 0.044)). Points represent individual patient values, dotted line represents the line of best fit.

