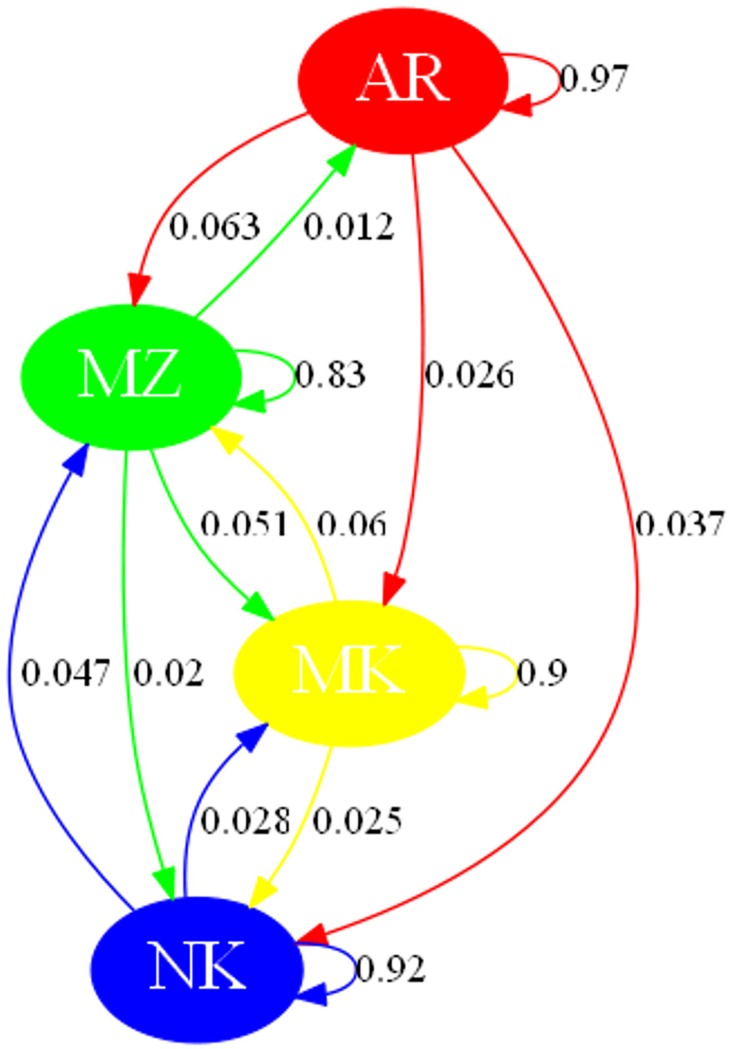
Fig 3. Gene flow network obtained from BAPS analysis and considering goat breeds of Algeria.
Self-looping arrows represent the own genetic sources of the population. Gene flows inferior to 0.01 were not displayed due to pruning in order to improve readability of the figure. The following abbreviations are used in the figure: MZ = M’Zabite; NK = Kabyle; AR = Arabia; MK = Makatia.

