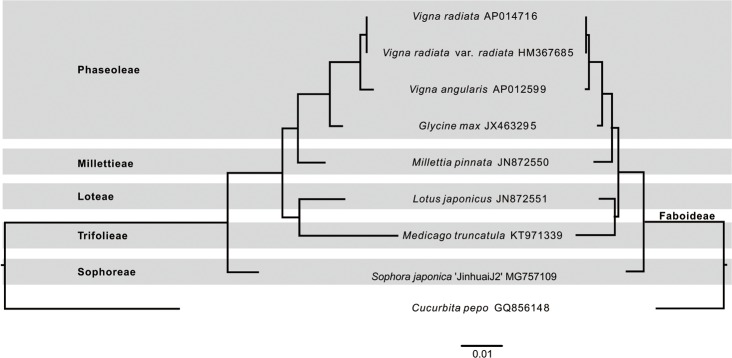
Fig 2. Nucleotide substitution rates in eight Faboideae species with fully sequenced mitochondrial genomes.
Branch lengths are proportional to rates of synonymous (left panel) and nonsynonymous (right panel) substitutions based on a concatenated alignments of 29 protein genes, and with the tree topology based on amino acid sequences from 29 protein coding genes.

