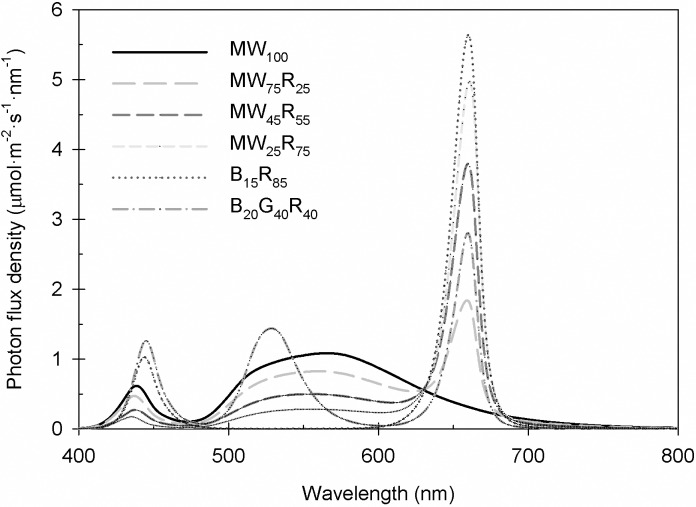
Fig 1. Spectral distribution of sole-source lighting treatments.
Six sole-source lighting treatments were delivered from mint white (MW), red (R), blue (B), and green (G) light-emitting diodes (LEDs) at total photosynthetic photon flux density (PPFD) = 160 μmol∙m−2∙s−1. The subscript values after each LED type indicate the percentages of the total PPFD delivered from each LED type.

