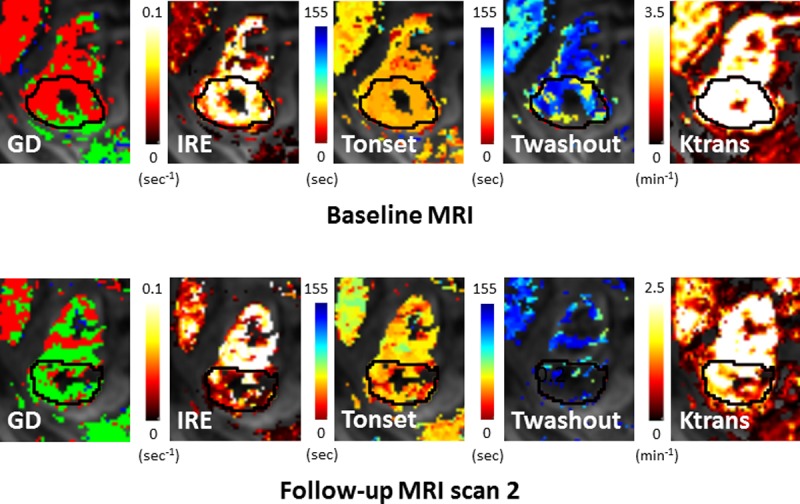
Fig 4. Selected DCE maps at baseline and follow-up MRI scan 2 for patient 3, left to right: The contrast enhancement GD map (green = plateau, red = washout, blue = persistent), IRE, Tonset, Twashout and Ktrans.

The corresponding image between MRI scans has been visually selected.
