Fig 5.

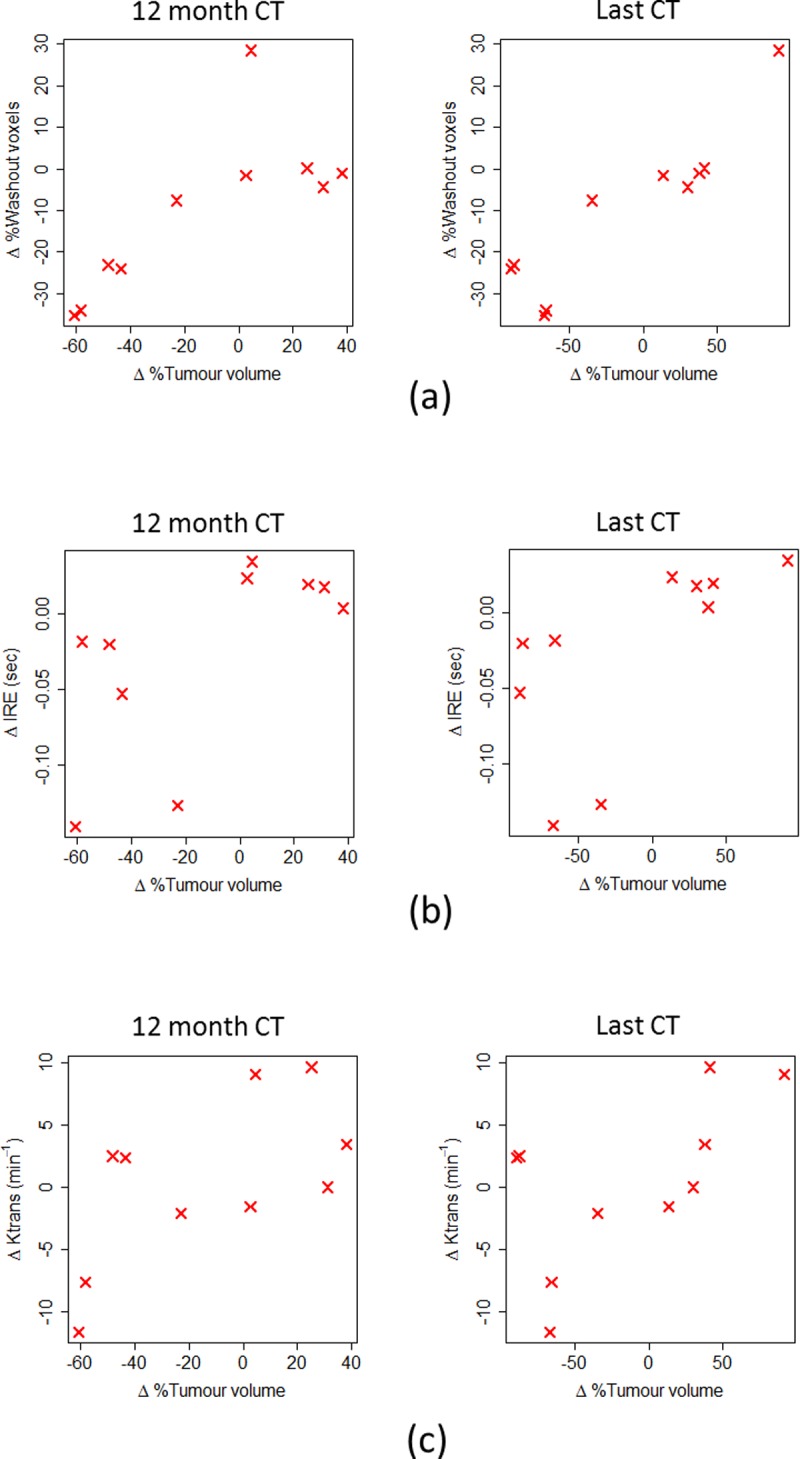
Scatterplots showing the change in (a) percentage washout voxels, (b) mean IRE and (c) mean Ktrans from follow-up MRI scan 2 versus (left–right) percentage tumour volume change at the 12 month and last follow-up CT.

Scatterplots showing the change in (a) percentage washout voxels, (b) mean IRE and (c) mean Ktrans from follow-up MRI scan 2 versus (left–right) percentage tumour volume change at the 12 month and last follow-up CT.